• Home
  • Search
  • My Listings
  • My Sales
  • Sellers
    • Sellers
    • Metro Markets
  • Buyers
    • Buyers
    • Calculators
    • Communities
    • Schools
  • News
  • About Me
  • « Previous Page
  • 1
  • …
  • 35
  • 36
  • 37
  • 38
  • 39
  • Next Page »

Getting Over 100% Of Your List Price

By David Arbit on Monday, July 6th, 2015

Percent_of_all_Sales_Above_X-percent-of-orig-price_NEW-702x500

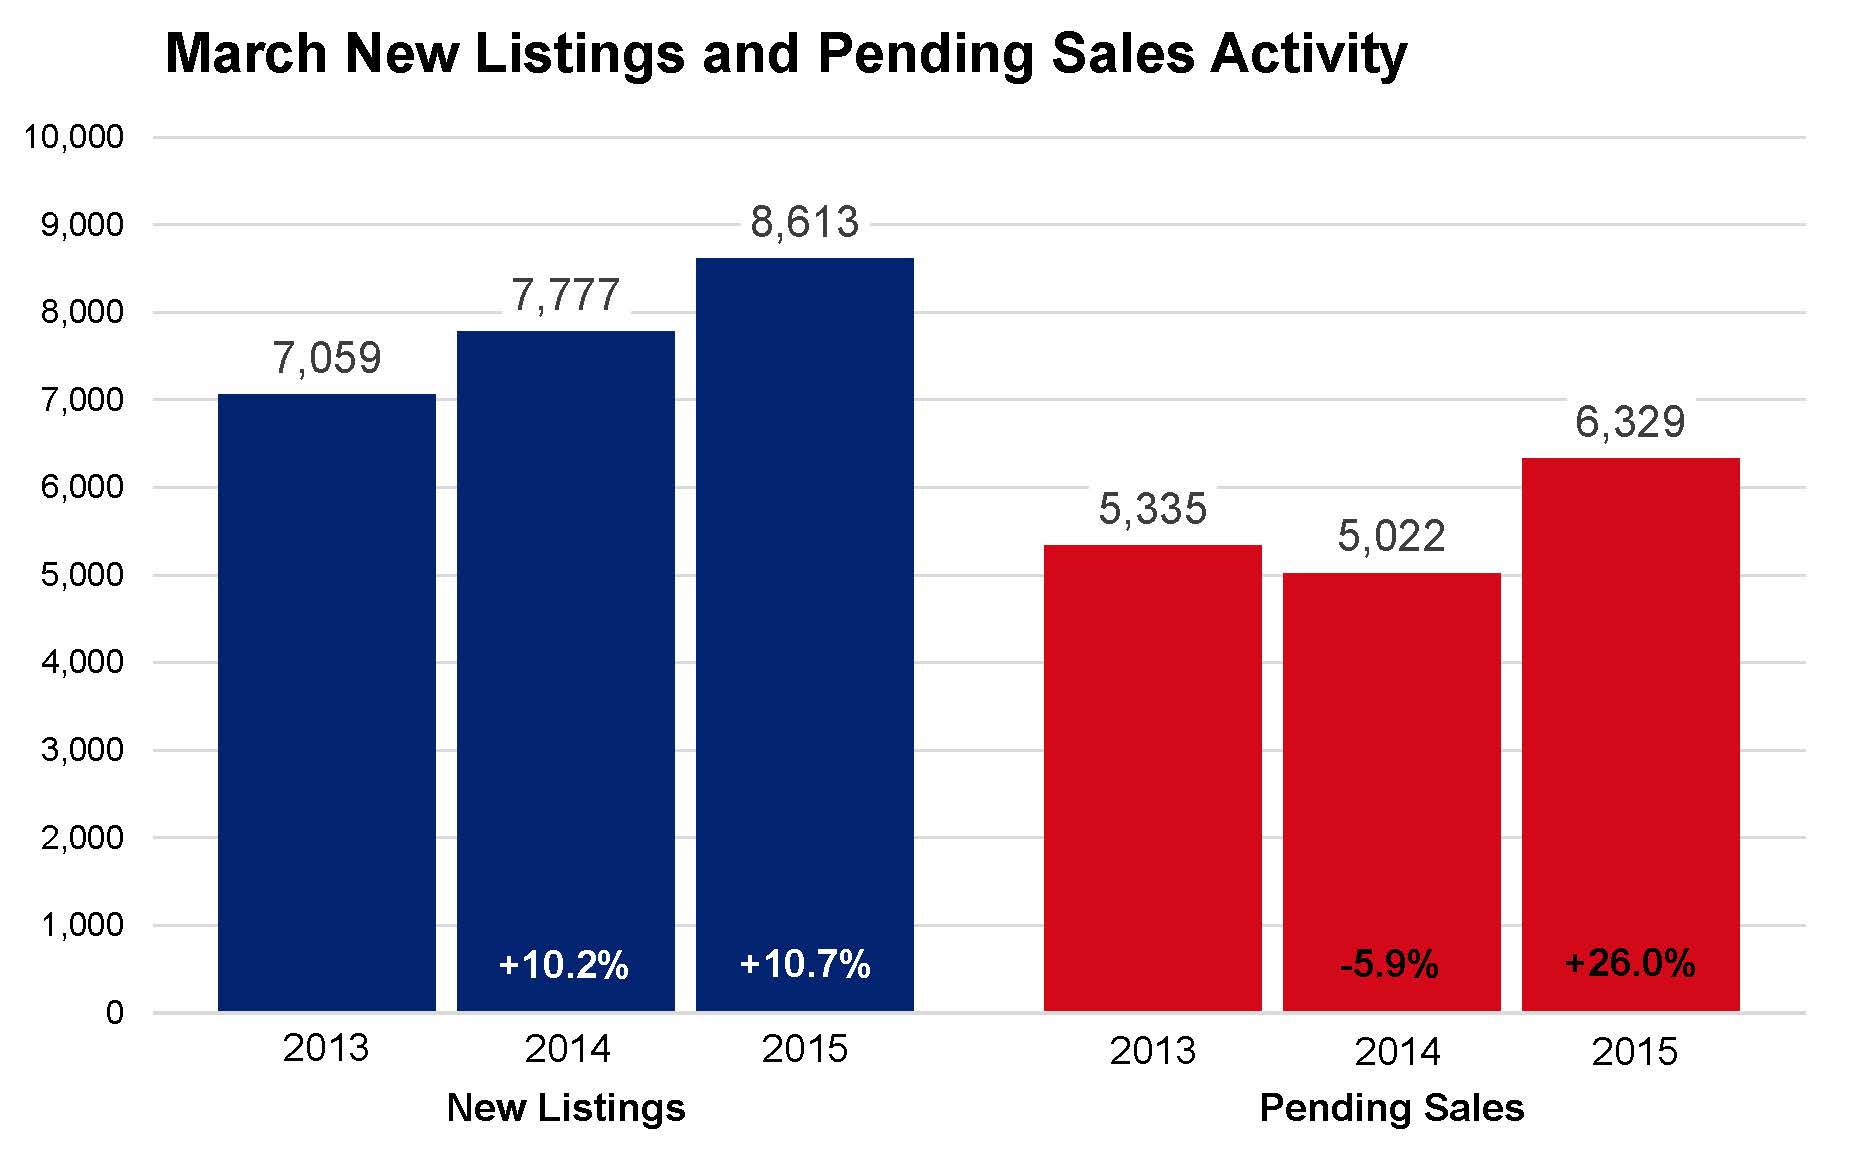
Real estate professionals understand that there is an imbalance between supply and demand in most markets across the U.S. Buyers have been highly motivated by a variety of factors ranging from low (but rising) interest rates, job growth, rising rents, general optimism and other dynamics. Seller activity, however, has been more restrained—though there’s some evidence that’s starting to change.

In the Twin Cities, that imbalance between supply and demand has driven down absorption rates. With 3.6 months supply of inventory (5-6 is considered “balanced”), our market is still tilting toward sellers. In other words, low inventory combined with strong demand means many sellers are receiving multiple offers on well-priced and well-presented listings.

Buyers are essentially competing with each other in order to purchase the limited number of desirable homes on the market. It’s a regional bidding war: as buyers vie against one another, they may offer more than the list price of the home in order to win the day. That means sellers are sometimes yielding over 100 percent of their list price. It’s a dream-come-true for sellers. Now it just has to appraise!

In 2005, a full 33.8 percent of all closed sales sold for over 100 percent of the current list price. That’s over 1 in 3 sellers receiving more than their asking price. That figure fell to 18.9 percent as the market crash began in 2007, and it touched that low again in 2011. By 2013—a very strong recovery year—the figure had increased to 26.4 percent. After falling again to 22.0 percent of all sales in 2014, the number of homes that sold above list price has increased to 24.8 percent so far in 2015. With the second half of 2015 yet to be recorded, it’s possible we will end the year near 2013 levels, particularly as buyers face the looming risk of rising interest rates combined with climbing rents and an improving labor market.

Ultimately, a healthy and sustainable housing market should be well-balanced between sellers and buyers, supply and demand. A healthy market means relative equilibrium, one that favors neither buyers nor sellers, but allows for both sides of the transaction to successfully reach their goals. A healthy market means sellers are enjoying some appreciation but home prices aren’t dramatically outpacing incomes. After about a decade of lurching between boom and bust, the Twin Cities housing market as well as others across the nation finally seem to be settling into a healthy groove—for the time being.

The Skinny

Is Bigger Better?

By David Arbit on Friday, June 26th, 2015

COMPARING SQUARE FOOTAGE TRENDS IN THE NEW CONSTRUCTION AND PREVIOUSLY OWNED SEGMENTS

New construction prices not only recovered far faster than previously owned prices, but they have also reached an all-time high (see chart). The median sales price for new construction was about $268,000 in 2009 but has since soared to new highs of just over $376,000. Previously owned prices, by contrast, reached $228,000 in 2006 but are now at $205,000. What’s driving this, you ask?

A multitude of factors have encouraged new home prices to stretch to new heights. Builders, contractors and suppliers will tell you that input costs have risen and that is true. Labor, copper, concrete, PVC, drywall and other related commodity prices have all risen lately. Steel prices, however—which make up a small share of overall construction costs—have fallen as China has flooded the global market with cheap steel. China now produces as much steel as the rest of the world combined. Lumber prices increased over the last few months, but have mostly declined since 2013. Lumber prices on the Chicago Mercantile Exchange are on-par with 2010. Let’s not digress too much.

Square-Footage-Trends-by-Segment-310x225

Something else noteworthy is happening, and this graph illustrates it pretty well. Though perhaps unsurprisingly, the total square footage of new construction is increasing at a far faster rate than the previously owned segment. Between May 2005 and May 2015, the median square footage of newly constructed homes rose 65.2 percent. During that same period, the median square footage of previously owned properties only increased 7.1 percent. For new construction, the typical home was built with 1,614 total finished square feet in 2005 but that figure grew to 2,667 total finished square feet by 2015. By contrast, the typical resale home had 1,700 square feet in 2005 but has only risen to 1,821 square feet as of May of this year. Interestingly, previously owned homes tended to be larger than new construction in 2005.

The nature of previously owned properties is that they don’t change that much. Those properties are already built. The 7.1 percent increase can be explained by two different dynamics. First, those who are selling and buying resale homes are tending to list and purchase slightly larger properties. Second, through remodeling projects such as a master bedroom addition or finishing off a basement or attic space, the existing housing stock can increase in finished square footage even though the foundation is already in the ground.

So what does this all mean? Well for one thing, those who have ruled out purchasing a newly built home because prices are at all-time highs might reconsider once they realize what’s causing that. Builders are constructing larger and larger homes, but not every newly built home is enormous and over $1 million. In fact, new construction can be fairly competitive with existing resale properties in certain areas and price points. Additionally, though the median sales price is at an all-time high, the price per square foot is not even back to bubble levels (see chart).

Another factor to keep in mind is that a lot of new construction in 2005 was condo-centric, particularly in and around both downtowns. As the condo bubble burst, development shifted toward single family products on larger suburban lots. Condos obviously tend to be smaller than single family homes, so that was certainly constraining square footages 10 years ago. In other words, a low baseline can impact this sort of analysis as much as if not more so than the current period. The large increase in new construction may be explained by a low 2005 figure as opposed to a high 2015 figure, though both dynamics

As we become ever more cognizant of energy efficiency, carbon footprints, insulation and everything that comes with it, there is some anecdotal evidence that smaller housing products are gaining popularity and it seems to be consumer-driven. There are even entire communities of “micro homes” (see article). So, despite the trend in new construction, perhaps bigger won’t always be better.

The Skinny

Twin Cities Home Price Analysis

By David Arbit on Thursday, June 18th, 2015

Assuming-5-pct-appreciation-310x225
After nearly 10 years, home prices are within 6.3 percent of their record high seen in June 2006. We have been here before, but we are in a different environment these days. The labor market has benefited from the longest stretch of private job growth on record, the stock market is at all-time highs, corporate balance sheets have seldom looked this good, we have a more regulated lending environment, consumers are deleveraged, our population has grown and consumers are more cautious this time around.

As we near (errr return to) “peak” pricing, there are several important items to bear in mind. First, this is not a brand new high in some foreign land, it is a return to where the market was 10 years ago but with better fundamentals (see above). Second—and as the chart suggests—if you assume that prices had followed their long term trend of increasing at 5.0 percent per year (nominal, not adjusted for inflation) as they have, we are still not back to where we would be assuming that rate of increase over the last 20 years. Third, this market is not fueled by irrational, unjustified speculation and exuberance—a leading cause of bubble-itus. Rather, it is fueled by low interest rates, rising rents, job growth, a diverse and robust local economy and slowly rising incomes.

Those who remember paying $0.05 for a cup of coffee or a candy bar like to remind us: prices will rise. It is inevitable. To expect home prices not to follow that trend is unrealistic. Once home prices began recovering, it was only a matter of time before they surpass their previous peak. Given all the improvements we have seen in the market and economy, it is no surprise we are back to where we were. But this time, under much better circumstances.
From The Skinny Blog.

The Skinny

May 2015 Real Estate Stats for the Twin Cities

By Aubray Erhardt on Thursday, June 11th, 2015

MEDIAN HOME PRICE JUST SHY OF RECORD HIGH AMIDST STRONGEST DEMAND IN A DECADE

With the sole exception of inventory, every market metric showed continued improvement during May. The number of signed purchase agreements in the 13-county Twin Cities increased 19.5 percent to 6,228. That marks the highest May pending sales count since 2005. Sellers, however, were only slightly more active than last year. New listings rose 0.3 percent to 8,590 for the month. Excluding April 2015, that’s the highest number of new listings for any month since the home buyer tax credit period of April 2010. Homes also sold in less time and sellers yielded a higher share of their list price.

The May 2015 median sales price of all MLS home sales increased 6.7 percent to $224,000. That’s within 3.6 percent of the May 2006 level and 6.3 percent of the record high seen in June 2006. Price per square foot offers a different perspective, as it accounts for the increasing square footage of homes selling. The average price buyers paid per square foot rose 3.5 percent to $128.

“Though it’s not the only important measure by a long shot, many factors have enabled prices to once again approach these levels,” said Mike Hoffman, Minneapolis Area Association of REALTORS® (MAAR) President. “It’s taken nearly 10 years just to get this close to break-even and this time the fundamentals are better, our population has grown and industry professionals and consumers are more cautious.”

Monthly-MSP

Persistent rent hikes, low mortgage rates, solid job growth and some noticeable wage growth are all encouraging consumers to seriously consider homeownership. But sellers and builders have been reluctant to list and build at the same levels they did when demand was this high 10 years ago. That has kept us in a seller’s market for some time. The number of days a listing spends on the market also reflects this. Those selling their homes are waiting a median of 35 days before accepting an offer at a median of 99.5 percent of their current list price. May months supply of inventory fell 12.2 percent to 3.6 months. Markets with between five and six months of supply are considered balanced.

Over the last 12 months, buyer activity increased the most in the townhome segment, where properties are also selling the fastest. Condominium prices increased the most of any property type over the same period. New construction pending sales for May increased at about half the rate of previously-owned properties. The number of homes on the market in May fell for all property and construction types.

The finance environment remains attractive. Mortgage rates are hovering around 4.0 percent, compared with a long-term average of 7.0 percent. The Twin Cities housing affordability index increased 2.7 percent since May 2014. An educated and literate workforce combined with a healthy and diverse economy helps Minnesota compete for top talent and businesses on an international scale.

“Many brokerages are seeing record volume even as prices move toward 2006 levels,” said Judy Shields, MAAR President-Elect. “Buyers in a variety of segments in our wonderful region are eager to make homeownership a reality. Prospective sellers should take note—they’re likely to receive top dollar for their property.”
From The Skinny Blog.

The Skinny

Exactly What is the Trend?

By David Arbit on Tuesday, June 2nd, 2015

“The trend is your friend.”

We don’t know who said it, or when. But we believe the spirit of that statement is to ignore the micro fluctuations in the data and focus on the overall, macro-level pattern. Let the trend speak to you. Ignore the noise in between. The noise is only there to confuse you. Actually, the noise is really there because buyer activity ebbs and flows with the freeze and thaw cycle as well as with the school year. Though it’s tempting to follow the seasonal peaks and valleys, it’s plain to see that prices and sales always decline between summer and fall, and then subside again between fall and winter. It’s as predictable as potholes in the Minnesota spring. As such, it’s less meaningful to compare June to October and far more meaningful to compare October of this year to October of last year. Because of this high degree of seasonality in our market, comparisons across all of our reporting environments utilize a year-over-year benchmark.

What-is-the-Trend
From The Skinny Blog.

The Skinny

April Pending Sales Highest for Any Month Since June 2005

By Aubray Erhardt on Tuesday, May 12th, 2015

The number of signed purchase agreements in the 13-county Twin Cities region reached a 10-year high for the month of April. The figure came up just shy of reaching a 10-year record high for any month. Buyers wrote 6,329 offers to purchase homes, a 26.0 percent increase from last April and the most for any month since June 2005. New listings also rose as sellers continued to regain confidence. The number of new listings increased 10.7 percent to 8,613 during the month. That’s the highest number of new listings for any month since the home buyer tax credit period of April 2010.

The median sales price sustained its upward trajectory, increasing 10.0 percent to $215,600. The median home price has now seen 38 months of year-over-year increases. Price per square foot—which accounts for the rising square footage of homes selling—rose a more modest 3.0 percent to $124. Months supply of inventory fell 5.6 percent to 3.4 months, and still points to an overall seller’s market. Days on market decreased for the first time this year. Those selling their homes are waiting an average of 85 days before accepting an offer.
Charts-for-PR

“Overall, buyers are truly out in force this spring,” said Mike Hoffman, President of the Minneapolis Area Association of REALTORS® (MAAR). “Climbing rents, consistent job growth and finally some beginning signs of wage growth are all encouraging Twin Citizens to invest in homeownership.”

As a result of the strong demand, inventory shortages in the most popular price ranges and neighborhoods can still be challenging for many buyers. Over the last 12 months, inventory levels fell 1.1 percent in the $100,000 to $249,999 range but rose 22.2 percent in the $250,000 to $499,000 range. The number of active listings for homes priced above $500,000 rose 21.4 percent.

Among the different property types, inventory levels fell 4.6 percent for condos and 0.9 percent for townhomes, but rose 10.0 percent for single-family properties. The number of homes on the market rose 6.2 percent over the past 12 months for previously owned homes, but the figure increased 19.3 percent for new construction homes.

The finance environment remains favorable. Mortgage rates are approximately 3.9 percent, compared with a long-term average of 7.0 percent. The Twin Cities housing affordability index actually increased since this time last year.
A diverse and growing regional economy has served the Twin Cities housing market well throughout the years. According to the Bureau of Labor Statistics, the Twin Cities has the fifth lowest unemployment rates of any major metropolitan area in the nation at 4.0 percent. Forbes ranked Minnesota as one of the top 10 best states for business, seventh in economic climate and second in quality of life.

“The numbers combined with the sense of urgency really paint a clear picture,” said Judy Shields, MAAR President-Elect. “Buyers are quite motivated, hoping to get in before rates rise, though both buyers and sellers stand to benefit from the current market environment.” From The Skinny Blog.

The Skinny

March Pending Sales Soar by the Most Since 2011, Highest Since 2005

By Aubray Erhardt on Friday, April 10th, 2015

The number of signed purchase agreements in the 13-county Twin Cities region surged by 30.0 percent to 5,301 contracts. Sellers were also confident, as new listings increased 21.4 percent to 7,887 during the month. That is the largest increase in pending sales since August 2011 and the highest March count since 2005. New listings showed the second largest increase since July 2013 and the highest March count since 2010. Inventory levels rose 0.7 percent to 14,127 homes, the second increase this year.

The median sales price rallied 10.5 percent higher to $210,000, the strongest gain in over a year. The median home price has now seen over 36 months of year-over-year increases. Price per square foot—which adjusts for the square footage of homes selling—rose a more modest 4.5 percent to $121. Absorption rates remained flat at 3.3 months, and suggest an overall sellers’ market. Days on market rose 7.4 percent to 102 days.

The role of foreclosures and short sales continued to diminish on both the list and buy sides. Traditional new listings comprised 92.2 percent of all seller activity, the highest level since October 2006. Traditional sales made up 84.9 percent of all closed sales, which is on-par with late-2007 levels.

The finance environment remains favorable. Mortgage rates continue to hover near multi-year lows at around 3.7 percent, compared with a long-term average of about 7.0 percent.

Improvements in the economy and household finances could partly offset the impact of rising prices and interest rates. The Twin Cities housing affordability index of 198 has been fairly stable since the end of 2014.

A diverse and robust regional economy has served the Twin Cities housing market well throughout various cycles. According to the Bureau of Labor Statistics, the Twin Cities has one of the lowest unemployment rates of any major metropolitan area in the nation at 4.0 percent.
From The Skinny Blog.

The Skinny

2015 Foreclosure & Short Sale Update

By David Arbit on Friday, March 20th, 2015

As many have noted, one of the biggest changes to the Twin Cities and national housing markets was the sudden influx and subsequent absorption of distressed properties. “Distressed” simply refers to any new listing, active listing or closed sale where the lender either owns the property (foreclosure) or the property was sold for less than the outstanding amount owed on the mortgage (short sale).

As both the public and private sectors began laying off workers in conjunction with other cost-cutting efforts around 2008 and 2009, many households begrudgingly became single-wage households or worse. That generated a notable increase in mortgage delinquencies, which led to banks repossessing homes and selling them short.

As financial institutions began listing these distressed homes for sale, buyers began taking advantage of the great deals. Many of those buyers were—and, to a lesser extent, are—investors, though some were ordinary families and individuals taking advantage of a historic opportunity.

2015-03-20-14_51_47-Greenshot-310x238Due to a variety of factors ranging from rising home prices to the longest stretch of private job growth in decades, the share of market activity that can be categorized as either foreclosure or short sale is easing. In 2011, foreclosures and short sales together made up exactly 50.0% of all closed sales in the 13-county metropolitan area even though they comprised less than 42.0% of all new listings. This means they made up a larger share of the sales pie than the listing pie, signaling robust demand for these bargain properties.

Fast forward to 2014. Last year, only 12.2% of all new listings were in distress while the figure was 16.4% for closed sales. Those numbers mark a dramatic decrease in the prevalence of distressed listing and sales activity in the Twin Cities region. Most of the active listings (inventory) in this segment has been absorbed off the market and institutions are listing fewer and fewer of them.

So why should you care about any of this? Fair question. After all, foreclosure market share doesn’t exactly make for exciting backyard barbeque conversations, unless you’re a housing researcher (I swear I have friends that aren’t computers). But who doesn’t love talking about home prices? There never seems to be a shortage of speculation regarding where home prices might be heading next. Some think we’re in another bubble, others think we’re returning to historically typical levels of stable price appreciation.

Since prices seem to be the preferred market barometer of choice for most consumers (anyone heard of an absorption rate or even price per square foot?), it stands to reason that many consumers and real estate professionals alike would have a vested interest in better understanding what’s affecting home prices.

2015-03-20-14_50_07-Greenshot-310x215By far the biggest factor affecting home prices is the percentage of all sales that are distressed—i.e. the distressed sales rate. Coincidentally, that is exactly what’s shown in the blue trendline to the left. Also plotted here is the median sales price for the metro. This chart shows the nature and strength of the relationship between the distressed market share and home prices.

2015-03-20-14_37_11-Greenshot-702x589The nature of the relationship is an inverse one and the magnitude is quite strong. In other words, when distressed market share increases, home prices tend to fall and vice versa. And you can just about bet the farm on that one. For those who are wondering, the R-square between these two variables is 0.9425 and the relationship is statistically significant. This means that about 94.25% of the variation in home prices can be attributed to variability in distressed market share. If you had a 94.25% chance of success in betting big on a single stock or a poker hand or your favorite Canterbury horse, wouldn’t you?

Gazing into the proverbial crystal ball, expect distressed market activity to fall below 10.0% for closed sales and likely below 8.0% for new listings. But those are just prognostications. Ultimately, if you’re wondering where home prices are heading next, simply follow the percentage of all closed sales that are either foreclosures or short sales.

Wasn’t that fun? Until next time!

From The Skinny Blog.

The Skinny

After three full years of price gains, recovery shows renewed vigor

By Aubray Erhardt on Thursday, March 12th, 2015

The Twin Cities housing market showed refreshed signs of strength last month, partly in anticipation of what looks to be a promising spring market as well as favorable interest rates. Buyer and seller activity surged in February. New listings increased 23.2 percent to 5,690 during the month, the largest year-over-year increase since July 2013. Pending sales—or a count of the number of signed purchase agreements—increased 21.8 percent to 3,834, the largest year-over-year increase since October 2012. With only two months in the books, already buyers and sellers have shown more activity than they did for any one month of 2014. Inventory levels were still lower, down 2.0 percent to 12,700 homes, but that trend is unlikely to continue.

The median sales price rose 10.4 percent to $202,000, the strongest gain since last February. This increase officially marks 36 consecutive months or three full years of year-over-year median price gains. Price per square foot—which adjusts for the square footage of homes selling—rose 6.6 percent to $120. Absorption rates remained flat at 3.0 months, and still technically favor sellers. That said, today’s market environment is slightly less competitive than in 2013. Days on market rose 7.1 percent to 106 days.

The market share of foreclosures and short sales continued to shrink on both the supply and demand side. Traditional new listings rose a substantial 33.8 percent, while foreclosure and short sale new listings each fell between 25 and 30 percent. Traditional pending sales rose a massive 41.5 percent, while foreclosure and short sale pendings each fell between 32 and 36 percent. This dynamic has partly enabled three consecutive years of rising prices.

“If February is any indication, this spring is shaping up to be everything that spring markets should be,” said Mike Hoffman, President of the Minneapolis Area Association of REALTORS® (MAAR). “The fact that we’re seeing large gains in buyer and seller activity mostly driven by traditional properties bodes quite well for consumer confidence at a critical time.”

The finance environment remains enormously attractive. Mortgage rates continue to hover between 3.5 and 4.0 percent. The long-term average is roughly 7.0 percent. This appealing affordability picture can potentially offset recent home price increases and also encourages renters to consider homeownership. The Twin Cities housing affordability index of 210 has actually increased 2.4 percent from last February.

A highly diverse and robust economy has served the Twin Cities housing market well throughout various cycles. According to the Bureau of Labor Statistics, the Twin Cities has the lowest unemployment rate of any major metro in the nation at 3.3 percent. Recently, national private job creation has accelerated toward 300,000 jobs per month.

“Even though every area and market segment is unique, what we’re seeing in the numbers is definitely reflected out in the community,” said Judy Shields, MAAR President-Elect. “After being cooped up all winter, people are eager to get out there and find their dream home.”

From The Skinny Blog.

The Skinny

Strong Start to Year Sets Tone for 2015

By Aubray Erhardt on Thursday, February 12th, 2015

The Twin Cities regional housing market started 2015 on an enthusiastic but not overly dramatic note. Both seller activity and pending buyer activity increased relative to January 2014. Sellers introduced 4,497 new listings to the marketplace, 5.9 percent more than last year. Buyers entered into 2,986 purchase agreements, 7.8 percent higher than the pending sales count at this time last year. Inventory levels were lower, down 6.3 percent to 11,926 homes currently on the market. Many in the industry are expecting more inventory as we approach the spring market—both in a month-to-month sense as well as year-over-year.

The median sales price rose 8.5 percent to $195,000, the strongest gain since last February. This increase marks 35 consecutive months of year-over-year median price gains. Price per square foot—perhaps a more telling figure—rose 6.6 percent to $118. Absorption rates were dead-even with last January. Months supply of inventory was flat at 2.9 and still suggests the arc of the market is bending toward sellers. That said, today’s landscape is slightly less competitive than in past months. Partly as a result, days on market until sale rose 7.5 percent to 100 days.

Digging deeper, the trend of less foreclosure and short sale activity continued. Traditional pending sales rose a significant 21.9 percent, while foreclosure and short sale pending sales each fell about 25 percent. That changing mix of product has helped catalyze the nearly three straight years of price gains seen in the region.

“Both buyers and sellers appear confident and energized and the traditional segment enjoyed a strong start to the year,” said Mike Hoffman, President of the Minneapolis Area Association of REALTORS® (MAAR). “The steady, ongoing improvement and normalization we saw in January could be indicative of the year as a whole but only time will tell.”

Surprisingly, interest rates have again sunk below the 4.0 percent mark. Historically and persistently low mortgage rates tend to spur purchase demand. This highly attractive financing environment can potentially offset home price increases and also encourages renters to consider homeownership. The Twin Cities housing affordability index of 206 remained stable. This means that the median household income was 106 percent higher than the necessary income needed to qualify for the median-priced home under current interest rates.

Another factor motivating home buyers is the dramatically improving jobs scene—both locally and nationally. In December, the Bureau of Labor Statistics reported that the Twin Cities again had the lowest unemployment rate of any major metro in the nation at 3.3 percent. At 5.6 percent, the national rate is the lowest it’s been since June 2008. Private job creation is accelerating and figures from past months have been revised upward.

“Consumers seem excited about the upcoming spring market,” said Judy Shields, MAAR President-Elect. “Weather permitting, we’re expecting a strong turnout for both buyers and sellers. It should be an exciting year!”

From The Skinny Blog.

The Skinny

  • « Previous Page
  • 1
  • …
  • 35
  • 36
  • 37
  • 38
  • 39
  • Next Page »

Follow Me

  • Dribbble
  • Facebook
  • LinkedIn
  • YouTube

Contact ME

All information deemed reliable but not guaranteed and should be independently verified.

Powered By WordPress | © 2026Migthy Agent LLC