• Home
  • Search
  • My Listings
  • My Sales
  • Sellers
    • Sellers
    • Metro Markets
  • Buyers
    • Buyers
    • Calculators
    • Communities
    • Schools
  • News
  • About Me
  • « Previous Page
  • 1
  • …
  • 34
  • 35
  • 36
  • 37
  • 38
  • …
  • 40
  • Next Page »

August activity strong with growth in sales and listings

By Aubray Erhardt on Wednesday, September 14th, 2016

Seller activity increased 2.1 percent since last August, as sellers introduced 7,072 new listings to the marketplace. Buyer activity also rallied. Pending sales rose 7.9 percent while closed sales gained 7.4 percent. To fuel those gains, buyers signed 5,728 new contracts and closed on 6,382 homes. That closed sales figure is on par with 2004 levels. Although the median sales price has reached its seasonal peak for 2016, it increased 5.7 percent since August 2015 to $237,750. Adding to the pressure facing buyers, inventory levels fell 18.8 percent to 13,933 active properties. Inventory constraints haven’t slowed down buyers yet, but additional listings are needed to ease the contentious landscape.
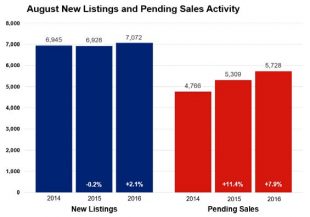
MAAR-August-2016-Stats-News-Release-310x217Low inventory has enabled homes to sell in near record time. Average days on market until sale fell 14.1 percent to 55 days. That’s the second fastest market time for any month since the beginning of 2007. The average percent of original list price received at sale was 97.9 percent, the highest figure for any August since 2005. Months supply of inventory fell 24.3 percent to 2.8 months—the lowest August figure on record since the beginning of 2003. Generally, five to six months of supply is considered a balanced market. This indicator measures the balance between supply and demand in the marketplace.

“Absorption rates under 3.0 months suggests things are still pretty tight out there as we transition to autumn,” said Judy Shields, Minneapolis Area Association of REALTORS® (MAAR) President. “But there are still peculiarities across locations and segments. Blaine is not Linden Hills and downtown condos are not suburban single family new construction. It’s important to have all the facts before making a move.”

Despite the fact that both seller and buyer activity increased in August, important asymmetries persist. Over the last three years, buyer activity has steadily marched higher while seller activity has essentially bounced around the 7,000 unit marker, thus straining supply levels.

A strong Twin Cities labor market has also helped promote housing recovery. The most recent national unemployment rate is 4.9 percent, though it’s a healthier 3.5 percent locally. The Minneapolis-St. Paul-Bloomington metropolitan area has the second lowest unemployment rate of any major metro area, trailing only Denver by 0.1 percent.

Locally, the 30-year fixed mortgage rate stands at 3.47 percent compared to a long-term average of about 8.0 percent. Rates are now at their lowest level in three years. Marginally higher rates were widely expected in 2016, but the Federal Reserve hasn’t made a move since last December. Markets currently peg the odds of a September rate hike at around 20.0 percent. Barring any surprising economic data, the Fed will likely raise rates this December.

“In the near term, buyer and seller activity always quiets down around this time of year and that shouldn’t cause concern,” said Cotty Lowry, MAAR President-Elect. “Over the long term, favorable interest rates, rising rents and a strong labor market should be conducive to housing. But we’ll need some additional inventory—particularly in the affordable brackets—in order to keep up with consumer demand.”
From The Skinny Blog.

The Skinny

Twin Cities Homes Selling in Record Time, But Key Differences Persist

By Aubray Erhardt on Friday, August 12th, 2016

Seller activity declined 5.5 percent since last July, as sellers introduced 7,522 new listings to the marketplace. Sales activity was slightly below year-ago levels. Closed sales fell 5.8 percent while pending sales—the number of signed purchase agreements—fell 3.1 percent. Buyers signed 5,560 new contracts and closed on 6,030 homes. That closed sales figure is on par with July 2003 levels. The July median sales price retreated slightly since June 2016, but increased 6.6 percent from July 2015 to $239,900. Mostly due to inventory constraints, prospective sellers are concerned about their ability to secure their next property in the current environment. Buyers saw little supply side relief, as inventory levels fell 18.1 percent to 14,457 active properties. The well-known inventory shortages haven’t slowed down buyers much, given June 2016 closed sales at a 12-year high.

historical-702x204

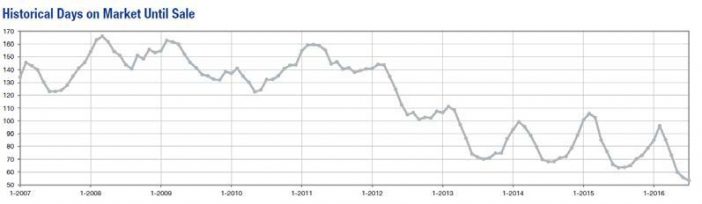
Low inventory, however, has helped draw out stronger offers. The average percent of original list price received at sale was 98.4 percent, the highest figure for any July since 2005. Low levels of for-sale housing also means the homes on the market tend to sell quickly. Cumulative days on market until sale fell 15.9 percent to 53 days. That’s the fastest market time for any month since the beginning of 2007. Months supply of inventory fell 23.7 percent to 2.9 months—the lowest July figure on record going back to the beginning of 2003. Generally, five to six months of supply is considered a balanced market.

MAAR-July-2016-Stats-News-Release-702x174

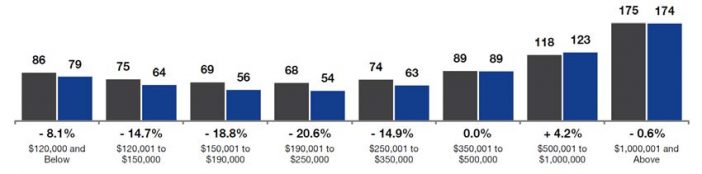
Our days on market indicator tells us that most homes are selling pretty quickly,” said Judy Shields, Minneapolis Area Association of REALTORS® (MAAR) President. “But that market-wide figure leaves out important differences between various communities, property types and price points. For example, the July market-wide average was 53 days but homes priced above $1 million are spending 174 days on the market.”

Over the last 12 months, properties in the $190,000 to $250,000 range have tended to sell the quickest, at an average of 54 days. As the price point rises, so does the amount of time spent on the market. There is a sweet spot whereby both lower and higher priced homes take longer to sell.

It’s also worth noting that the average market time figure can be skewed by properties that linger on the market. The median days on market was actually 25 for July, reflecting the mid-point where half the homes spent longer than 25 days on the market and half spent less.

“Those selling properties above the $500,000 mark know that patience is a virtue even in our current environment,” said Cotty Lowry, MAAR President-Elect. “The supply-demand balance in that segment is less competitive than the entry-level price points, plus consumers are limiting how much house they buy.”

From The Skinny Blog.

The Skinny

Ten Years Later To The Month: Twin Cities Home Prices Eclipse 2006 Record

By Aubray Erhardt on Tuesday, July 19th, 2016

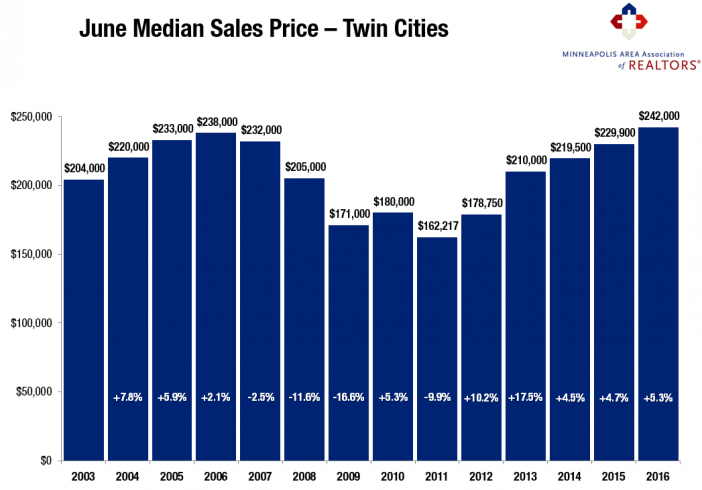
The June 2016 median sales price for residential properties has reached a new all-time high, eclipsing the previous June 2006 record of $238,000. This measure of home prices rose 5.3 percent from June 2015 to $242,000. Seller activity rose 0.5 percent since last June to 8,727 new listings. Sales activity was roughly even with last year. Closed sales increased a modest 0.2 percent while pending sales—the number of signed purchase agreements—fell 0.7 percent. Buyers signed 6,175 new contracts and closed on 7,094 homes. That’s the highest volume of closed sales for any month going back to June 2004, a 12-year high. Mostly due to inventory constraints, prospective sellers are concerned about their ability to secure their next property in the current environment. June offered little supply-side relief, as inventory levels fell 18.2 percent to 14,214 active properties. Despite the attempt, consistent inventory shortages haven’t slowed down buyers much, given closed sales at a 12-year high.

Low inventory has helped draw out stronger offers. The average percent of original list price received at sale was 98.7 percent in June, the highest figure for any month since May 2005. Low levels of for-sale housing also means the homes on the market tend to sell quickly. Cumulative days on market until sale fell 16.7 percent to 55 days. That’s the fastest market time for any month since the beginning of 2007. Months supply of inventory fell 23.7 percent to 2.9 months—the lowest June figure on record going back to the beginning of 2003. Generally, five to six months of supply is considered a balanced market. While the metro as a whole is favoring sellers, not all areas, segments or price points necessarily reflect that. Market conditions are encouraging some sellers but not enough to fuel the demand seen in recent months.

July-MSP-Image-702x490“Prices returning to 2006 levels is nothing to fear,” said Judy Shields, Minneapolis Area Association of REALTORS® (MAAR) President. “This market is grounded in good fundamentals: supply and demand, smarter lending standards, job and wage growth, population growth, healthier household finances and rising rents. In the lead-up to 2006, home prices were driven by irrational exuberance and lax lending standards.”

A healthy Twin Cities labor market has also been conducive to our housing recovery. The most recent national unemployment rate is 4.9 percent, though it’s 3.1 percent locally. The Minneapolis-St. Paul-Bloomington metropolitan area has the third lowest unemployment rate of any major metro area. The fact that lower-priced foreclosures and short sales comprise a shrinking share of sales activity also helps with the recovery. Traditional (non-lender-mediated) properties made up 95.0 percent of all closed sales—the highest level in almost 10 years.

For the time being, the risk of higher interest rates seems to have subsided after “Brexit” and in light of other global economic concerns. Locally, the 30-year fixed mortgage rate fell to 3.5 percent compared to a long-term average of about 8.0 percent. Rates are now at their lowest level in three years. Marginally higher rates were widely expected in 2016, but further rate hikes are unlikely for the duration of the year.

“It shouldn’t be all that surprising that we’re back to where we were ten years ago,” said Cotty Lowry, MAAR President-Elect. “The forces behind this recovery are far more sustainable than last time. Clearly the Twin Cities economy is booming, even though buyers are still eager for more listings.”
From The Skinny Blog.

The Skinny

Sellers Uninspired by Record May Sales Activity

By Aubray Erhardt on Tuesday, June 14th, 2016

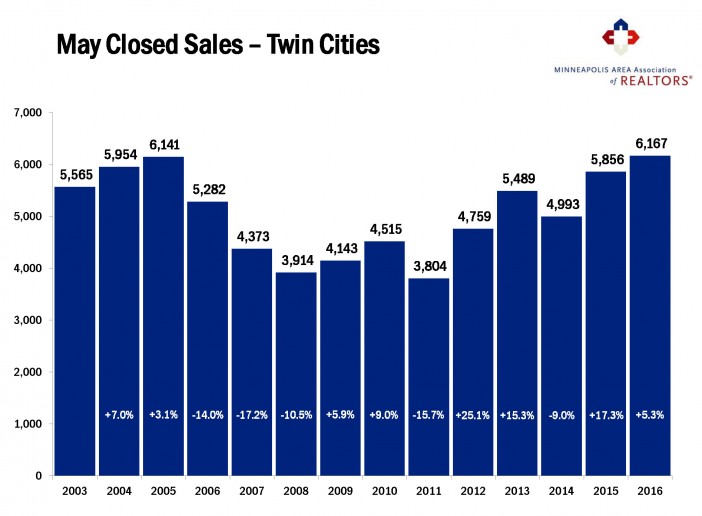
Pending home purchase activity exceeded year-ago levels for the 18th consecutive month. Buyers signed 6,809 new purchase agreements, a 9.9 percent gain compared to May 2015. Closed sales, however, rose 5.3 percent to 6,167—the highest May closed sales figure on record. In large part due to low inventory, would-be sellers are concerned about their ability to secure their next property in the current competitive environment. Inventory levels fell 20.6 percent to 13,372 active properties. Because of record demand, weak supply and a more expensive mix of homes selling, the May median sales price rose 5.7 percent to $236,826—second only to June 2006 for the highest monthly median sales price on record.

2016-05_image-702x516

Since the median percent of current list price received at sale was 100.0 percent, sellers effectively had the same chance of getting offers above their current list price as they did below. Those odds were exactly fifty-fifty—as they were in May 2005. That’s not the case for original list price, however. Cumulative days on market fell 21.1 percent to 60 days. That’s the fastest market time for any month since the beginning of 2007. Months supply of inventory fell 28.9 percent to 2.7 months—the lowest May figure on record going back to the beginning of 2003. Generally, five to six months of supply is considered a balanced market. While the metro as a whole is favoring sellers, not all areas, segments or price points necessarily reflect that. Market conditions are encouraging some sellers but not enough to fuel the demand seen in recent months.

“By a margin of just 26 units, last month’s closed sales reached a new record for May,” said Judy Shields, Minneapolis Area Association of REALTORS® (MAAR) President. “Despite record demand, not every home sells the day it hits the market in multiple offers. Some areas are more susceptible than others. Sellers hoping for short market times should know price strategy is still one of the most important factors in marketing your home.”

Smarter lending practices, job and wage increases, population growth, the ongoing threat of higher interest rates and relentlessly rising rents have all contributed to strong sales activity. A competitive Twin Cities labor market has also contributed to our housing recovery. Traditional (non-lender-mediated) listings made up 93.3 percent of all closed sales—the highest level in almost 10 years.

The most recent national unemployment rate is 4.7 percent, though it’s 3.4 percent locally. The Minneapolis-St. Paul-Bloomington metropolitan area has the fourth lowest unemployment rate of any major metro area. The 30-year fixed mortgage rate continued to hover around 3.6 percent compared to a long-term average of approximately 8.0 percent. Rates took a surprising dive after the Federal Reserve announced the first hike last year. Marginally higher interest rates were widely expected in 2016, though futures contracts currently peg the odds of a June rate hike at 4.0 percent and a July rate hike at 36.0 percent.

“Interest rates and job growth are fueling the demand in our market,” said Cotty Lowry, MAAR President-Elect. “But we have a serious inventory shortage that we know is holding back buyers, meaning there is still pent-up demand that may not have existed in a more balanced market.”
From The Skinny Blog.

The Skinny

April Sellers Bring Full Price Offers

By Aubray Erhardt on Tuesday, May 17th, 2016

New Listings showed a second year-over-year decline in 2016 while pending purchase activity rose for the 17th straight month. Buyers signed 6,373 new purchase agreements, a small but important 1.6 percent gain compared to a record-setting April 2015. Due to the well-known supply shortages in our market, would-be sellers are concerned about their ability to secure their next property in the current environment. Inventory levels fell 19.4 percent to 12,849 active properties. Because of record demand, weak supply and a more expensive mix of homes selling, the April median sales price rose 7.7 percent to $231,500. Median list price, by contrast, has already reached and exceeded its previous record, perhaps an indication that the median sales price could do the same this year.

As was the case in March, serious buyers came out swinging in April. In fact, sellers had the same chance of getting offers above their current list price as they did below. Those odds were exactly fifty-fifty—as they were in 2005. That’s not the case for original list price, which indicates that once a home is properly priced, serious buyers are willing to write full-price offers. Unsurprisingly, homes tended to sell in less time, with cumulative days on market declining 14.1 percent to 73 days. That’s the lowest April figure since 2007. Months supply of inventory fell 27.8 percent to 2.6 months—the lowest April figure on record going back to 2003. Generally, five to six months of supply is considered a balanced market. While our region as a whole is favoring sellers, not all areas, segments or price points necessarily reflect that.

“This is an important milestone that speaks to the health of our market,” said Judy Shields, Minneapolis Area Association of REALTORS® (MAAR) President. “Sellers should not interpret this to mean they are guaranteed offers above their list price. Every price range, area and segment is still unique. It’s more important now than ever to properly price your home. This means buyers–particularly those in multiple offers–should be ready to make full price offers on the properties that best fits their needs.”

The last time absorption rates, consumer demand and home prices were where they are today, the median percent of current list price received at sale was also 100.0 percent, so this isn’t entirely unfamiliar territory. There was also significantly more inventory in 2004 and 2005. The marketplace is finally closing the gap from the recession before advancing—sustained by smarter lending policy, job and wage increases, population growth, the risk of higher interest rates and relentlessly rising rents. It’s worth noting that traditional sales tend to fetch a higher ratio of sales price to list price. For the first April since 2007, traditional sales made up over 90.0 percent of overall sales, which boosts the percentage of current list price received.

The national unemployment rate for April was unchanged at 5.0 percent. With a local unemployment rate of 4.0 percent, the Minneapolis-St.Paul-Bloomington metropolitan area was among the top ten large metros with the lowest unemployment rate. The 30-year fixed mortgage rate continued to hover just above 3.6 percent compared to a long-term average of about 8.0 percent. Rates took a surprising dive after the Federal Reserve announced the first hike last year. Marginally higher rates were widely expected in 2016, even though a June rate hike seems unlikely.

“The economy is still strengthening and the market is very competitive,” said Cotty Lowry, MAAR President-Elect. “Serious buyers must be prepared to make strong offers right away or risk not having their offer accepted.”
From The Skinny Blog.

The Skinny

It’s Going DOM For Real

By David Arbit on Wednesday, April 27th, 2016
KCM-DOM-702x527
We don’t often talk about the national housing market, because, well, that isn’t really a thing. You read that right. There is no national housing market! The same way there is no national weather forecast. You don’t grab an umbrella in Miami based on the weather in Seattle, do you? So why would you base a decision to buy or sell real property in Minneapolis on data from Phoenix, Cleveland, Las Vegas and St. Louis? You wouldn’t. Because that would be silly.

So from the standpoint of a family or individual in the midst of a local decision-making process, national data is more or less worthless. Worse, it can actually lead to negative outcomes if a local decision was made based on national figures. Perhaps a Case-Shiller report showed that home prices are rising across their 20-city composite index. But that doesn’t mean prices are rising in every neighborhood or city, or even a particular section of a neighborhood. However, when it comes to bench-marking how we’re doing in Minnesota against other states, national-scale market data can play a marginally useful role.

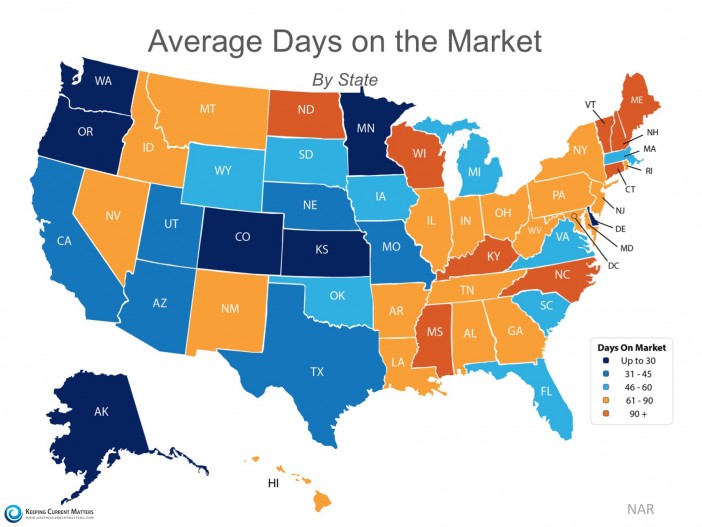
The folks at Keeping Current Matters (KCM) have taken information from NAR’s Monthly REALTOR® Confidence Survey to generate a heat map showing hot spots and cold spots around the country. The darkest blue represents states where homes sell quickly (30 days and under). The darkest orange represents states where homes tend to sell in over 90 days.

As you can see (and as most agents know), Minnesota homes tend to sell quickly. Our state is in the top quintile, among a group of only five other states. It’s a safe bet that our acute inventory shortage plays a large role in this dynamic, but our extremely competitive labor market, attractive business climate, affordable housing stock, high quality of life, diversity, top-notch schools and our treasured parks and water bodies also play a big role in attracting and keeping people here. That translates into strong demand for housing, which—when combined with very low supply levels—means homes tend to sell pretty quickly.

From The Skinny Blog.

The Skinny

Spring Market Draws out Eager Buyers; Sellers Still on Hold

By Aubray Erhardt on Thursday, April 14th, 2016

With the spring market officially underway, both buyer and seller activity rose in March 2016 compared to last March. Buyers signed 5,861 new purchase agreements, pushing pending sales up a respectable 12.6 percent. Would-be sellers were still concerned about their ability to secure their next property in this competitive environment, so new listings only increased 0.5 percent. Hence, supply levels remained near 13-year lows. Compared to last March, inventory levels fell 20.6 percent to 11,893 active properties. Prices continued their disciplined trek back towards levels last seen 10 years ago. The median sales price rose 5.7 percent from last March to land at $222,000. Median list price, by contrast, has already reached and exceeded its previous record, perhaps an indication that the median sales price could do the same this year.

Buyers came out swinging with strong offers in March. Sellers accepted offers closer to their list price, as the percent of original list price received at sale was up to 96.7 percent. Homes tended to sell in less time, with cumulative days on market declining 17.5 percent to 85 days. Months supply of inventory fell 28.6 percent to 2.5 months—the third lowest figure on record going back to 2003. Generally, five to six months of supply is considered a balanced market. While the metropolitan area as a whole is favoring sellers, not all areas, segments or price points necessarily reflect that.

“Between new loan applications and anecdotal evidence, we knew this spring would be another big one for buyers,” said Judy Shields, Minneapolis Area Association of REALTORS® (MAAR) President. “The small gain in seller activity was nice, but it falls well short of the supply levels needed to sustain the demand we’re seeing. That should be motivating for sellers, but it’s still important to understand that your home needs to be priced right.”

It’s also useful to assess specific area and segment performance, since no single property spans the entire metro area nor all market segments and price points. The percentage of sales that were foreclosure or short sale fell to 13.4 percent while traditional pending sales rose 16.2 percent. Single-family homes continued to dominate sales volume, even though townhomes had the strongest increase in closed sales compared to last March, followed by condos. Previously-owned sales had a stronger performance than new construction. Sales activity in the $200,000 and below range declined 13.8 percent while sales activity between $200,000 and $300,000 rose 10.5 percent and activity above $300,000 rose 3.4 percent. Cities with the highest median home price include North Oaks, Orono, Edina, Plymouth, Chanhassen and Minnetonka.

The national unemployment rate ticked up to 5.0 percent in March—reflecting more confident job-hunters actively seeking work. The most recent wage data is also encouraging—a positive factor that could offset declining affordability brought on by rising prices. Locally, the latest Bureau of Labor Statistics figures show the Minneapolis-St. Paul-Bloomington metropolitan area was among the top eight metros with the lowest unemployment rate. The 30-year fixed mortgage rate is about 3.7 percent compared to a long-term average of about 8.0 percent. Rates took a surprising dive after the Federal Reserve announced the first hike last year. Nevertheless, marginally higher rates are expected in 2016.

“Serious buyers should be prepared to make their strongest offer right up front this spring,” said Cotty Lowry, MAAR President-Elect. “Traffic at open houses is as strong as I can recall, which makes additional options on the supply side of the equation that much more critical.”

From The Skinny Blog.

The Skinny

Is the Lack of Housing Inventory Taking the Spring Out of Your Market?

By Aubray Erhardt on Monday, April 4th, 2016

It’s no secret that we’re experiencing an inventory shortage. Consumers and real estate professionals are feeling the frustration of a low housing supply after submitting multiple offers without success. This trend is not unique to the Minneapolis and St. Paul area, according to Jonathan Smoke, Chief Economist for Realtor.com:

“The increase in sales is resulting in continued tighter-than-tight supply—measured by NAR to be four months in January… that metric measures the number of months it would take to sell the current inventory of available homes, at the current pace. Six to seven months’ worth of homes on the market is considered normal; four months is cray-cray.”

The present conditions have some professionals wondering what brought us to this point. In an article written by Steve Cook of Real Estate Economy Watch, he lists six reasons that explain what’s keeping owners from selling:

1. One in five homeowners with a mortgage still doesn’t have enough equity to sell.
2. Buyers who bought during the 2004-2006 boom are waiting to make a profit.
3. Inventory shortages are squeezing move-up buyers.
4. There are five million fewer homes to be sold.
5. New home construction was decimated by the housing crash and hasn’t yet recovered.
6. The Boomer timetable has been delayed.

Here are some ideas that might help sellers or real estate professionals adapt to changing conditions:

1. Know your market. Each area is unique and it’s important to stay informed so you can anticipate possible changes. Use MAAR’s market reports or InfoSparks to find the most recent numbers.
2. Be honest and up front. You can’t control the market but you may prevent some disappointment or unreasonable expectations by giving an accurate picture of the market on the front end.
3. Be Prepared to Act Fast. When entering into a multiple offer situation it’s important to have finances in order and be prepared to make quick decisions.
4. Focus on the positive. David Arbit, MAAR’s Director of Research and Economics recently reported that job and wage growth trends remain encouraging. The unemployment rate continues to decline and we’re steadily producing sufficient private jobs to absorb newcomers to the labor force. Wages are growing at their fastest pace in years—an encouraging sign that should offset declining affordability brought on by rising prices and interest rates. Locally, the latest Bureau of Labor Statistics figures show the Minneapolis-St. Paul-Bloomington metropolitan area had the second lowest unemployment rate of any major metro area at 3.1 percent compared to 4.9 percent nationally. Mortgage rates are still below 4.0 percent compared to a long-term average of about 8.0 percent. Rates actually went down after the Federal Reserve’s December hike, though marginally higher rates are expected this year.
5. Serve as a resource. At the end of the day, it is the client’s decision on whether or not they choose to sell. However, real estate professionals should provide the resources necessary to help their client make the most informed decision (market stats, financing, pricing, marketing, etc.).

Judy Shields, Minneapolis Area Association of REALTORS® (MAAR) President has shared her perspective on the situation:

“This spring market will be a telling one for a number of reasons. Many would-be buyers are waiting on sellers. Early indicators such as mortgage applications suggest demand is only likely to strengthen. The uncertainty comes on the supply side, but there’s a good chance we’ll see more inventory this year.”

As the spring season unfolds, we can prepare for the unexpected and work within the current market conditions. Low supply levels are likely to persist in the near term, but it’s important to note that buyers are still finding quality homes—perhaps with a bit of patience and persistence. Hang in there. It’s well worth it.

Sources:

6 Ways to Explain Low Inventory
DAILY REAL ESTATE NEWS | WEDNESDAY, MARCH 23, 2016

Where Have All the Sellers Gone?
REAL ESTATE ECONOMY WATCH | MARCH 17, 2016

From The Skinny Blog.

The Skinny

Buyer and Seller Activity Increase as Spring Market and Warm Weather Arrive

By Aubray Erhardt on Monday, March 14th, 2016

February Pending sales rose 6.7 percent while new listings increased 3.0 percent. The all-too-familiar supply crunch continued as inventory levels fell 19.4 percent to 10,953 active properties. Prices continued their steady climb back towards 2006 levels. The median sales price gained a sustainable 3.7 percent from last February and is now at $207,395. Median list price, by contrast, has already reached and exceeded its previous record, perhaps an indication that the median sales price could do the same this year.

Compared to last February, sellers accepted offers closer to their list price, as the percent of original list price received at sale was up 1.2 percent to 95.3 percent. Those offers also arrived more quickly compared to last year. Cumulative days on market declined 9.4 percent to 96 days, which is a brisk pace for a winter(ish) month. Absorption rates closely mirrored active listing levels as months supply of inventory fell 28.1 percent to 2.3 months—the second lowest figure on record, behind only January 2016. Generally, five to six months of supply is considered a balanced market. While the metropolitan area as a whole is favoring sellers, not all areas, segments or price points necessarily reflect that.

“This spring market will be a telling one for a number of reasons,” said Judy Shields, Minneapolis Area Association of REALTORS® (MAAR) President. “Many would-be buyers are waiting on sellers. Early indicators such as mortgage applications suggest demand is only likely to strengthen. The uncertainty comes on the supply side, but there’s a good chance we’ll see more inventory this year.”

It’s important to assess specific area and segment performance, since no single property spans the entire metro area nor all market segments and price points. The percentage of sales that were foreclosure or short sale fell to 16.2 percent while traditional pending sales rose 8.0 percent. Single-family homes continued to dominate sales volume, even though townhomes had the strongest increase over the last 12 months. Previously-owned sales increased 15.5 percent over the same period, compared to a 6.1 percent increase for new construction. Sales activity in the $150,000 and below range declined 9.4 percent while activity in all other price ranges is rising.

Nationally, job and wage growth trends remain encouraging. The unemployment rate continues to decline and we’re steadily producing sufficient private jobs to absorb newcomers to the labor force. Wages are growing at their fastest pace in years—an encouraging sign that should offset declining affordability brought on by rising prices and interest rates. Locally, the latest Bureau of Labor Statistics figures show the Minneapolis-St. Paul-Bloomington metropolitan area had the second lowest unemployment rate of any major metro area at 3.1 percent compared to 4.9 percent nationally. Mortgage rates are still below 4.0 percent compared to a long-term average of about 8.0 percent. Rates actually went down after the Federal Reserve’s December hike, though marginally higher rates are expected this year.

“Warmer than average temperatures have enabled home shoppers to start hunting early this year,” said Cotty Lowry, MAAR President-Elect. “Buyers appear ready for another blockbuster year, putting the charge on sellers to meet all this demand. Those considering a move would be wise to consult with a professional to better understand their position in the marketplace.”
From The Skinny Blog.

The Skinny

Twin Cities Housing Market Has Most Closed Sales Since 2005

By Aubray Erhardt on Wednesday, January 20th, 2016

At a press conference today, REALTOR® associations reported that the Twin Cities Metropolitan Area had the best year in terms of the number of closed sales since 2005. Closed sales finished 2015 13.7% better than 2014, boasting 56,390 compared to 49,604 in 2014.

The median sales price in 2015 was $220,000, a 7.0% increase from $205,600 in 2014. This is on top of gains in recent years of +14.4% in 2013 and 11.9% in 2012. The median sales price of single family homes was up 5.6% and townhouse-condos were up 3.8% over the prior year, continuing multi-year positive trends. Distressed sales were a mere 10.6% of all closed sales in 2015. This represents a one-year change in sales of foreclosures and short sales of -26.7%.

“Last year (2015) really showcased the durability of our economic and housing recovery, despite a few obstacles. As sales hit a 10-year high, the Twin Citizens are just as committed to homeownership as ever. Attractive rates, rising rents, job growth, wage increases and the lowest unemployment rate of any major metro area will continue to be positive factors for real estate,” said Judy Shields, President of the Minneapolis Area Association of REALTORS®

Months’ supply of inventory ended the year at an unprecedented low of 2.1 months. This metric indicates how long it would take to sell-off all existing inventory if no new inventory was added and is generally considered balanced, favoring neither buyer nor seller, at 5.0 months. While this metric indicates a sellers’ market that may leave some buyers with fewer options, it also has some market watchers asking themselves whether we’ve seen the supply bottom. While inventory is certainly a metric to watch it’s probably best measured and compared throughout the selling season and not at year end.

“Since inventory conditions vary across the metro and market conditions change quickly, would-be sellers are encouraged to contact their REALTORS® for an updated market analysis. Your home might be worth more than you think,” said Bob Clark, President of the Saint Paul Area Association of REALTORS®.

Days on market continued to shrink, ending 2015 at just 76 days on the market – a 10-year record low.

Percent of original list price, a metric that demonstrates a relationship of the original list price compared to the final sales price remains strong at 96.6% overall and across market segments. For example, this means if a home was originally listed at $100,000 its final sales price was $96,600.

Single family homes and townhouse-condo segments were at 96.6% of original list. Previously owned was at 96.4%. New construction topped out a 99.6% of original list. This indicates sellers have regained their pricing power and are accepting near-full price offers on their listings.

“We know that well maintained, appropriately priced homes with amenities are selling fairly quickly but moreover the data shows that as well,” said Clark.
From The Skinny Blog.

The Skinny

  • « Previous Page
  • 1
  • …
  • 34
  • 35
  • 36
  • 37
  • 38
  • …
  • 40
  • Next Page »

Follow Me

  • Dribbble
  • Facebook
  • LinkedIn
  • YouTube

Contact ME

All information deemed reliable but not guaranteed and should be independently verified.

Powered By WordPress | © 2026Migthy Agent LLC