

• Home
  • Search
  • My Listings
  • My Sales
  • Sellers
    • Sellers
    • Metro Markets
  • Buyers
    • Buyers
    • Calculators
    • Communities
    • Schools
  • News
  • About Me
  • « Previous Page
  • 1
  • …
  • 53
  • 54
  • 55
  • 56
  • 57
  • …
  • 83
  • Next Page »

Inventory

Weekly Report

Weekly Market Report

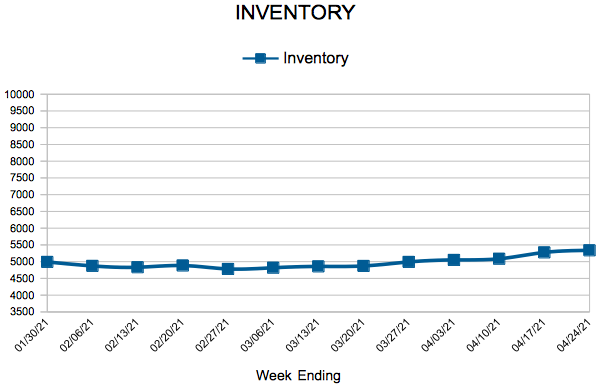
For Week Ending April 10, 2021

Home prices are not the only rising cost for prospective homebuyers. ATTOM Data Solutions’ latest property tax analysis of nearly 87 million single-family homes in the U.S. found the average property tax bill rose 4.4 percent from 2019 to 2020, to an average of $3,719 for a single-family home. Nationwide, the average effective tax rate was 1.1% of the property’s value in 2020, down slightly from 1.14% in 2019.

In the Twin Cities region, for the week ending April 10:

  • New Listings increased 27.1% to 1,658
  • Pending Sales increased 20.8% to 1,249
  • Inventory decreased 49.3% to 5,086

For the month of March:

  • Median Sales Price increased 10.4% to $328,000
  • Days on Market decreased 36.1% to 39
  • Percent of Original List Price Received increased 2.7% to 101.9%
  • Months Supply of Homes For Sale decreased 52.6% to 0.9

All comparisons are to 2020

Click here for the full Weekly Market Activity Report. From MAAR Market Data News.
Weekly Report

Inventory

Weekly Report

Weekly Market Report

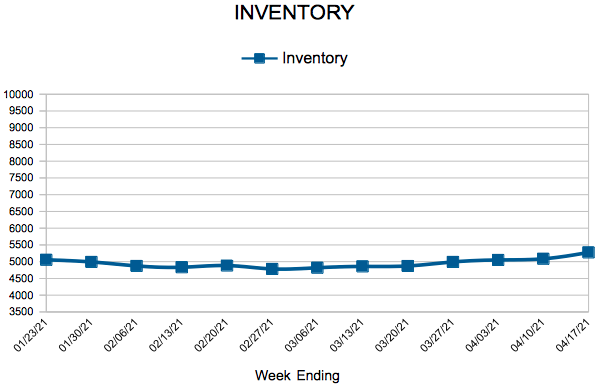
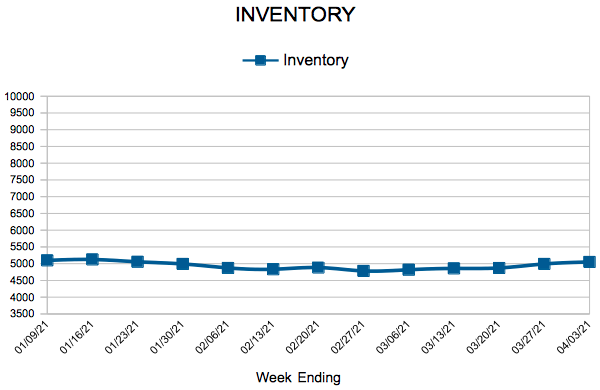
For Week Ending April 3, 2021

The University of Michigan’s latest Consumer Sentiment Index came in at 84.9 points, up from 76.8 in February and the highest level since last March’s 89.1 reading. The index is an economic indicator of the overall health of the economy as determined by consumer opinion. Increasing values point to increasing consumer confidence in their own financial health and the health of the overall economy.

In the Twin Cities region, for the week ending April 3:

  • New Listings decreased 7.6% to 1,406
  • Pending Sales increased 21.8% to 1,358
  • Inventory decreased 49.4% to 5,051

For the month of February:

  • Median Sales Price increased 11.5% to $314,000
  • Days on Market decreased 31.3% to 46
  • Percent of Original List Price Received increased 2.1% to 100.1%
  • Months Supply of Homes For Sale decreased 47.1% to 0.9

All comparisons are to 2020

Click here for the full Weekly Market Activity Report. From MAAR Market Data News.
Weekly Report

Inventory

Weekly Report

Weekly Market Report

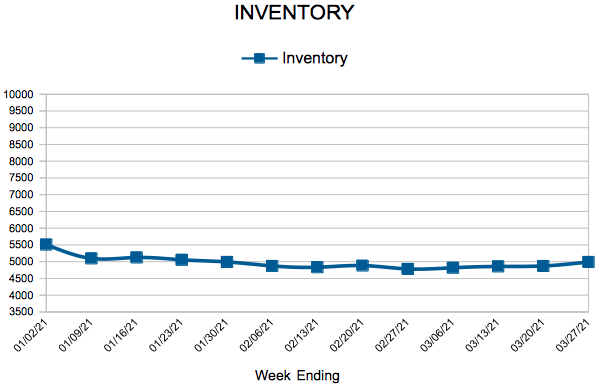
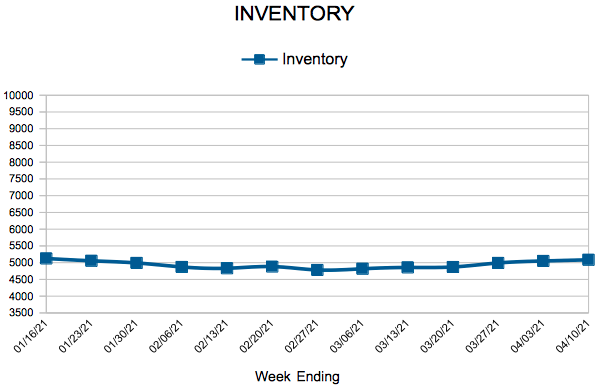
For Week Ending March 27, 2021

As the spring market is in full swing and home prices are ticking up, mortgage rates have moved higher in recent weeks as well. Freddie Mac reports that the national average rate for a 30-year fixed-rate mortgage rose to 3.17% with an average of .6 points. While rates are still below the average of 3.5% for the same week last year, the year over year comparison has been tightening in recent weeks.

In the Twin Cities region, for the week ending March 27:

  • New Listings decreased 3.8% to 1,479
  • Pending Sales increased 15.5% to 1,327
  • Inventory decreased 49.0% to 4,992

For the month of February:

  • Median Sales Price increased 11.5% to $314,000
  • Days on Market decreased 31.3% to 46
  • Percent of Original List Price Received increased 2.1% to 100.1%
  • Months Supply of Homes For Sale decreased 47.1% to 0.9

All comparisons are to 2020

Click here for the full Weekly Market Activity Report. From MAAR Market Data News.
Weekly Report

Weekly Market Report

For Week Ending December 15, 2018

The U.S. Federal Reserve recently raised the benchmark borrowing rate to a range of 2.25 to 2.50 percent. It is the fourth increase in 2018 and brings the rate to its highest level in a decade. As a result, borrowing money will be more expensive, particularly for credit card purchases. Fed Chair Jerome Powell stated that a rate increase at this time was appropriate for a healthy economy. Fed actions do not necessarily affect mortgage rates, but they can be influential.

In the Twin Cities region, for the week ending December 15:

  • New Listings increased 9.5% to 702
  • Pending Sales decreased 6.7% to 723
  • Inventory increased 1.0% to 9,487

For the month of November:

  • Median Sales Price increased 8.2% to $265,000
  • Days on Market decreased 7.1% to 52
  • Percent of Original List Price Received decreased 0.1% to 97.3%
  • Months Supply of Inventory increased 10.5% to 2.1

All comparisons are to 2017

Click here for the full Weekly Market Activity Report. From The Skinny Blog.

Weekly Report

Weekly Market Report

For Week Ending December 8, 2018

The month of December often equates to a full-scale slowdown in residential real estate, as thoughts shift from buying homes to buying gifts and plane tickets to visit family and friends. This year could be different. The Federal Reserve is set to raise interest rates one more time in 2018. Interest rate hikes don’t necessarily create mortgage rate hikes, but they can. This may cause more purchase offers ahead of deeper affordability concerns in 2019.

In the Twin Cities region, for the week ending December 8:

  • New Listings increased 1.4% to 773
  • Pending Sales decreased 8.3% to 716
  • Inventory increased 2.1% to 9,994

For the month of November:

  • Median Sales Price increased 8.2% to $265,000
  • Days on Market decreased 7.1% to 52
  • Percent of Original List Price Received decreased 0.1% to 97.3%
  • Months Supply of Inventory increased 5.0% to 2.1

All comparisons are to 2017

Click here for the full Weekly Market Activity Report. From The Skinny Blog.

Weekly Report

Weekly Market Report

For Week Ending December 1, 2018

While recent stock market activity has displayed some heart-pounding drops and rallying rises, that volatility has not created the same tidal waves within residential real estate. Increasing home prices and mortgage rates have indeed created a sense of immediacy for some buyers and turned others away due to affordability concerns, but these decisions appear to be rooted in longer-term trends rather than the effects of a media headline or presidential tweet.

In the Twin Cities region, for the week ending December 1:

  • New Listings increased 7.0% to 877
  • Pending Sales decreased 9.0% to 904
  • Inventory increased 1.5% to 10,437

For the month of October:

  • Median Sales Price increased 8.6% to $265,000
  • Days on Market decreased 7.7% to 48
  • Percent of Original List Price Received increased 0.2% to 97.9%
  • Months Supply of Inventory remained flat at 2.4

All comparisons are to 2017

Click here for the full Weekly Market Activity Report. From The Skinny Blog.

Weekly Report

Weekly Market Report

For Week Ending November 24, 2018

With each passing week, it is evident that residential real estate markets across the nation are poised to finish 2018 with positive energy and room for optimism. Even in an environment of rising home prices and mortgage rates, we are finding relative balance in city after city when looking specifically at year-over-year trends. While it’s true that sales and new listings are down compared to last year at this time for some price ranges and home types, it is not often by much.

In the Twin Cities region, for the week ending November 24:

  • New Listings increased 16.7% to 525
  • Pending Sales decreased 7.2% to 670
  • Inventory increased 2.0% to 10,852

For the month of October:

  • Median Sales Price increased 8.6% to $265,000
  • Days on Market decreased 7.7% to 48
  • Percent of Original List Price Received increased 0.2% to 97.9%
  • Months Supply of Inventory remained flat at 2.4

All comparisons are to 2017

Click here for the full Weekly Market Activity Report. From The Skinny Blog.

Weekly Report

  • « Previous Page
  • 1
  • …
  • 53
  • 54
  • 55
  • 56
  • 57
  • …
  • 83
  • Next Page »

Follow Me

  • Dribbble
  • Facebook
  • LinkedIn
  • YouTube

Contact ME

All information deemed reliable but not guaranteed and should be independently verified.

Powered By WordPress | © 2026Migthy Agent LLC