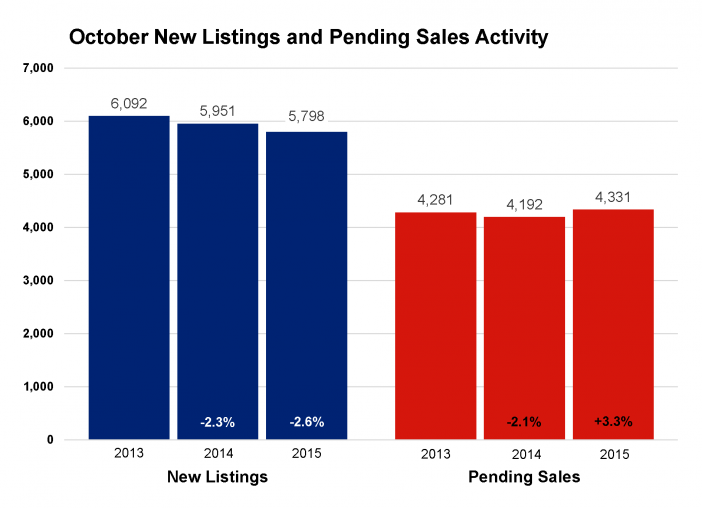
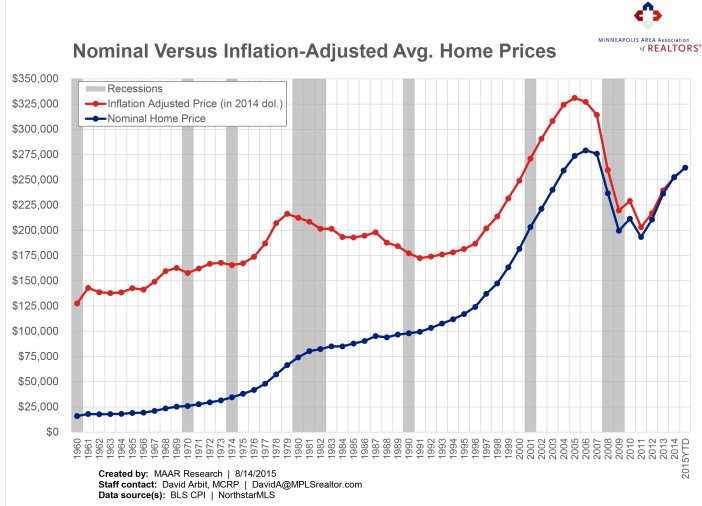
February Pending sales rose 6.7 percent while new listings increased 3.0 percent. The all-too-familiar supply crunch continued as inventory levels fell 19.4 percent to 10,953 active properties. Prices continued their steady climb back towards 2006 levels. The median sales price gained a sustainable 3.7 percent from last February and is now at $207,395. Median list price, by contrast, has already reached and exceeded its previous record, perhaps an indication that the median sales price could do the same this year.
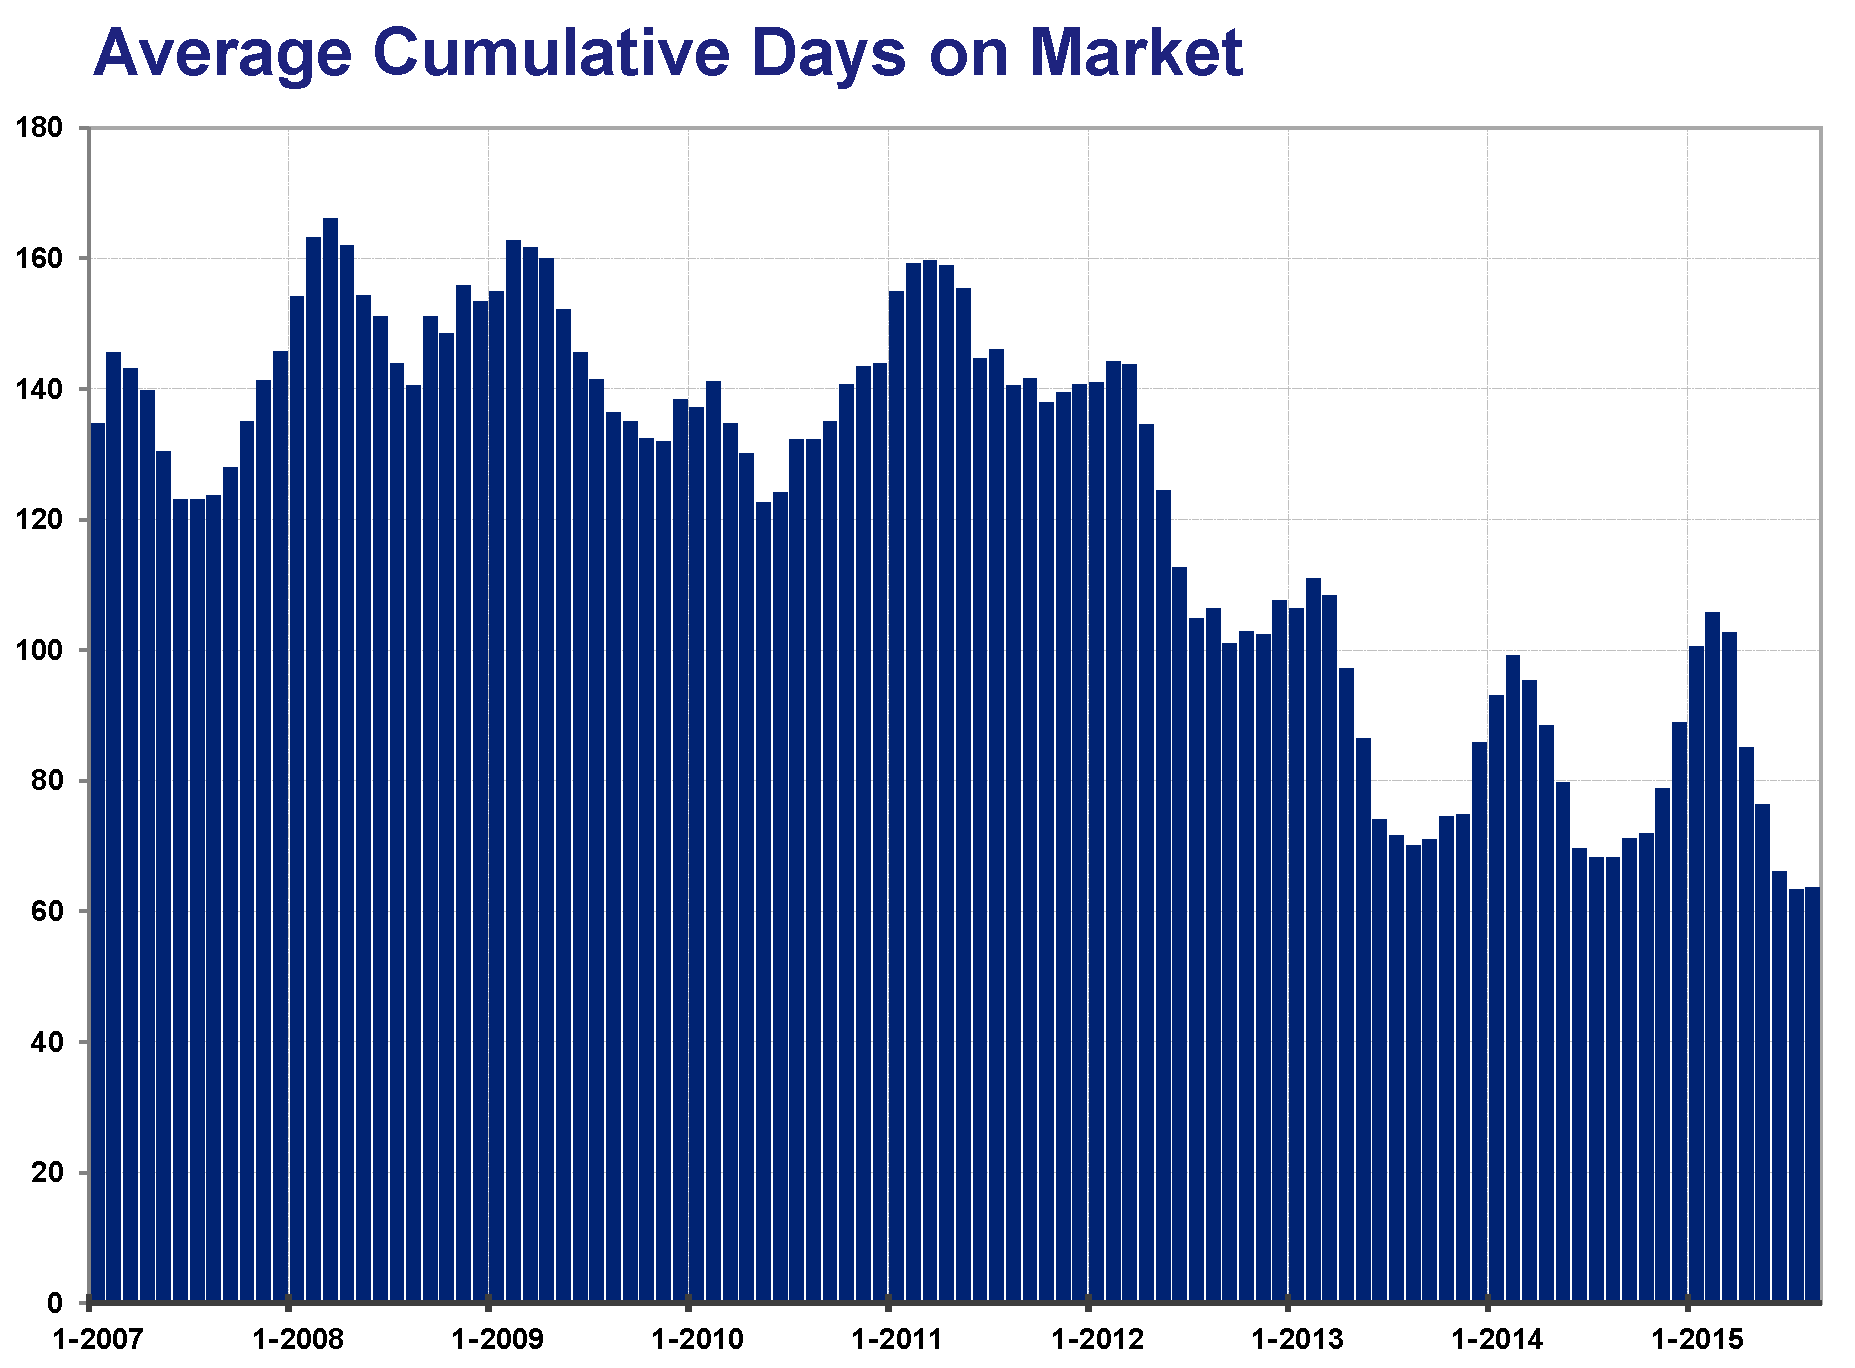
Compared to last February, sellers accepted offers closer to their list price, as the percent of original list price received at sale was up 1.2 percent to 95.3 percent. Those offers also arrived more quickly compared to last year. Cumulative days on market declined 9.4 percent to 96 days, which is a brisk pace for a winter(ish) month. Absorption rates closely mirrored active listing levels as months supply of inventory fell 28.1 percent to 2.3 months—the second lowest figure on record, behind only January 2016. Generally, five to six months of supply is considered a balanced market. While the metropolitan area as a whole is favoring sellers, not all areas, segments or price points necessarily reflect that.
“This spring market will be a telling one for a number of reasons,” said Judy Shields, Minneapolis Area Association of REALTORS® (MAAR) President. “Many would-be buyers are waiting on sellers. Early indicators such as mortgage applications suggest demand is only likely to strengthen. The uncertainty comes on the supply side, but there’s a good chance we’ll see more inventory this year.”
It’s important to assess specific area and segment performance, since no single property spans the entire metro area nor all market segments and price points. The percentage of sales that were foreclosure or short sale fell to 16.2 percent while traditional pending sales rose 8.0 percent. Single-family homes continued to dominate sales volume, even though townhomes had the strongest increase over the last 12 months. Previously-owned sales increased 15.5 percent over the same period, compared to a 6.1 percent increase for new construction. Sales activity in the $150,000 and below range declined 9.4 percent while activity in all other price ranges is rising.
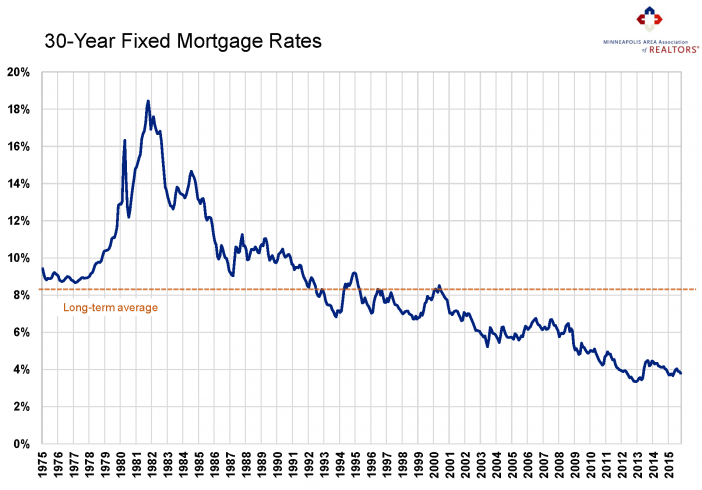
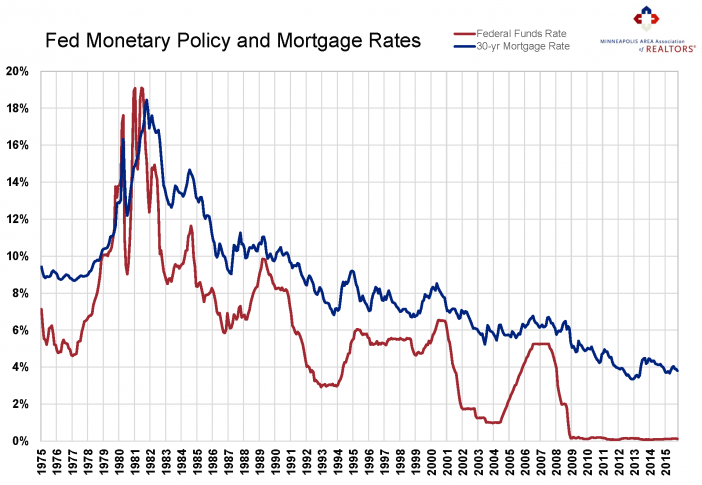
Nationally, job and wage growth trends remain encouraging. The unemployment rate continues to decline and we’re steadily producing sufficient private jobs to absorb newcomers to the labor force. Wages are growing at their fastest pace in years—an encouraging sign that should offset declining affordability brought on by rising prices and interest rates. Locally, the latest Bureau of Labor Statistics figures show the Minneapolis-St. Paul-Bloomington metropolitan area had the second lowest unemployment rate of any major metro area at 3.1 percent compared to 4.9 percent nationally. Mortgage rates are still below 4.0 percent compared to a long-term average of about 8.0 percent. Rates actually went down after the Federal Reserve’s December hike, though marginally higher rates are expected this year.
“Warmer than average temperatures have enabled home shoppers to start hunting early this year,” said Cotty Lowry, MAAR President-Elect. “Buyers appear ready for another blockbuster year, putting the charge on sellers to meet all this demand. Those considering a move would be wise to consult with a professional to better understand their position in the marketplace.”
From The Skinny Blog.