• Home
  • Search
  • My Listings
  • My Sales
  • Sellers
    • Sellers
    • Metro Markets
  • Buyers
    • Buyers
    • Calculators
    • Communities
    • Schools
  • News
  • About Me
  • « Previous Page
  • 1
  • …
  • 31
  • 32
  • 33
  • 34
  • 35
  • …
  • 40
  • Next Page »

Gung-Ho Sellers Post Largest Increase in Nearly Three Years

By David Arbit on Wednesday, September 19th, 2018

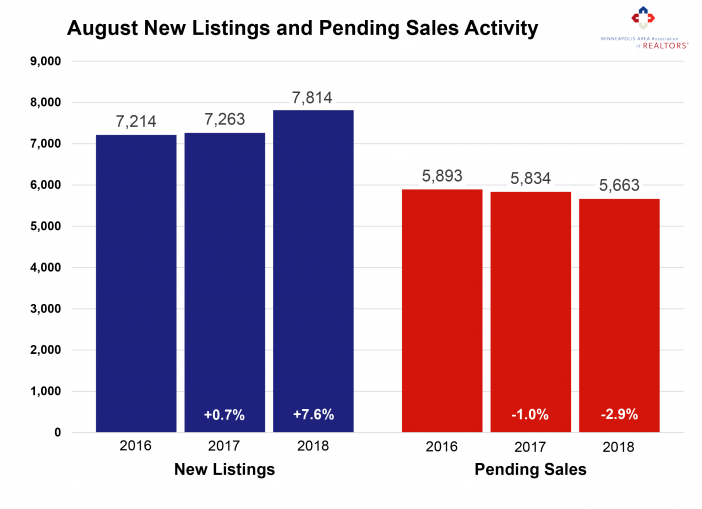
More sellers are feeling optimistic about listing their homes just as humidity, cabin weekends and food-on-a-stick give way to rakes, school buses and sweater vests. Compared to last August, Twin Cities sellers listed 7.6 percent more homes on the market. That was the largest increase since late-2015. Although buyers signed 2.9 percent fewer contracts than last year, they did manage to close on slightly more deals. Three of the last four months had increases in new listings; three of the last four months had decreases in pending sales. This trend of rising seller activity and moderating buyer activity suggests we could be approaching those long-awaited inventory gains. Sure enough, the 7.8 percent decline was the smallest decrease in inventory in over three years. Months supply was down just 3.8 percent to 2.5 months.
That said, today’s buyers still face plenty of competition over limited supply. Sellers yielded an average of 99.2 percent of their original list price and 100.1 percent of their current list price, illustrating how drastically undersupplied markets tend to favor sellers. The shortage is especially noticeable at the entry-level prices, where multiple offers and homes selling for over list price have become commonplace. The move-up and upper-bracket segments are less competitive and—for the most part—much better supplied. The market remains relatively tight, but there are some early signs that things could be loosening up for buyers.

August 2018 by the Numbers (compared to a year ago)
• Sellers listed 7,814 properties on the market, a 7.6 percent increase
• Buyers closed on 6,629 homes, a 0.2 percent increase from last August
• Inventory levels for August fell 7.8 percent compared to 2017 to 12,243 units
• Months Supply of Inventory was down 3.8 percent to 2.5 months
• The Median Sales Price rose 6.3 percent to $268,000, a record high for August
• Cumulative Days on Market declined 16.7 percent to 40 days, on average (median of 21)
• Changes in Sales activity varied by market segment

o Single family sales fell 0.8 percent; condo sales rose 15.3 percent; townhome sales increased 1.1 percent
o Traditional sales rose 1.5 percent; foreclosure sales sank 35.4 percent; short sales dropped 31.3 percent
o Previously-owned sales were down 0.5 percent; new construction sales increased 20.9 percent
From The Skinny Blog.

The Skinny

Sales Flatten while Sellers Capitalize on Price Gains

By David Arbit on Thursday, August 16th, 2018

New listings increased this July compared to last year, which could hint at a flurry of sellers looking to take advantage of this strong market. July marked the second increase in seller activity since November 2017. Meanwhile, buyer activity flattened out after seven months of year-over-year declines. This trend of rising seller activity and moderating buyer activity could mean more inventory coming down the pipeline. Increasing seller activity combined with a cool-down in demand is consistent with a loosening marketplace. That said, buyers shopping this summer and fall will still face stiff competition. Cooling buyer activity is likely a reflection of the shortage of homes for sale. Sellers yielded an average of 99.8 percent of their original list price and 100.6 percent of their current list price, illustrating how undersupplied markets tend to favor those with something to sell. The shortage is especially noticeable at the entry-level prices, where multiple offers and homes selling for over list price have become increasingly common. The move-up and upper-bracket segments are less competitive and better supplied. The market remains relatively tight, but there are some early signs that things could be loosening up to provide relief to buyers.

July 2018 by the Numbers (compared to a year ago)

Sellers listed 7,671 properties on the market, a 4.1 percent increase
Buyers closed on 6,242 homes, almost dead-even with last July
Inventory levels for July fell 13.5 percent compared to 2017 to 11,709 units
Months Supply of Inventory was down 11.1 percent to 2.4 months
The Median Sales Price rose 6.6 percent to $268,000, a record high for July
Cumulative Days on Market declined 17.4 percent to 38 days, on average (median of 18)
Changes in Sales activity varied by market segment

Single family sales fell 1.8 percent; condo sales rose 13.4 percent; townhome sales increased 5.2 percent
Traditional sales rose 1.2 percent; foreclosure sales sank 39.3 percent; short sales dropped 23.3 percent
Previously-owned sales were even with last year; new construction sales increased 14.0 percent

From The Skinny Blog.

The Skinny

Sellers: flat. Buyers: down. Prices: up.

By David Arbit on Wednesday, July 18th, 2018

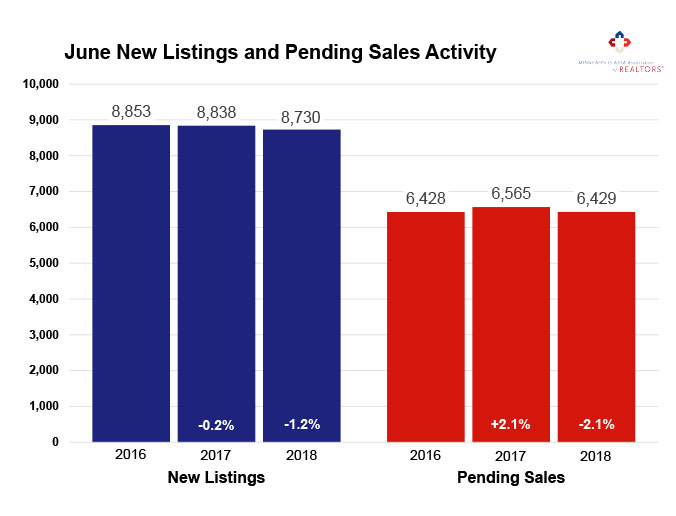
Seller activity was relatively flat in June while buyers pulled back somewhat. For the first time since 2010, new listings surpassed 9,000 in May of this year. That’s encouraging, even though June seller activity was down slightly compared to last year. Increasing or steady seller activity combined with a cool down in demand is consistent with a loosening marketplace. That said, buyers shopping this spring and summer will still face stiff competition. While sellers are receiving full-price-or-better offers in record time, listings still need to show well and be priced properly. June marked the seventh consecutive month of year-over-year declines in closed sales, likely reflecting the shortage of homes for sale.

Strong demand and low supply means sellers yielded an average of 100.3 percent of their list price in June, a record high for any month since at least the beginning of 2003. The shortage is especially noticeable at the entry-level prices, where multiple offers and homes selling for over list price have become increasingly common.

The move-up and upper-bracket segments are less competitive and better supplied. Yes, the housing market is tight out there—sometimes frustratingly so. But over 54,000 Twin Cities buyers and sellers have managed to successfully transact real property so far this year.

June 2018 by the Numbers (compared to a year ago)

Sellers listed 8,730 properties on the market, a 1.2 percent decrease
Buyers closed on 7,063 homes, a 8.1 percent decrease
Inventory levels for June fell 15.9 percent compared to 2017 to 11,374 units
Months Supply of Inventory was down 14.8 percent to 2.3 months
The Median Sales Price rose 5.7 percent to $271,900, a record high
Cumulative Days on Market declined 14.6 percent to 41 days, on average (median of 16)
Changes in Sales activity varied by market segment

Single family sales sank 7.1 percent; condo sales rose 8.4 percent; townhome sales declined 13.7 percent
Traditional sales fell 6.6 percent; foreclosure sales sank 39.3 percent; short sales dropped 39.0 percent
Previously-owned sales fell 7.4 percent; new construction sales decreased 4.3 percent

From The Skinny Blog.

The Skinny

Good news for sellers may finally be luring them into the market

By David Arbit on Monday, June 18th, 2018

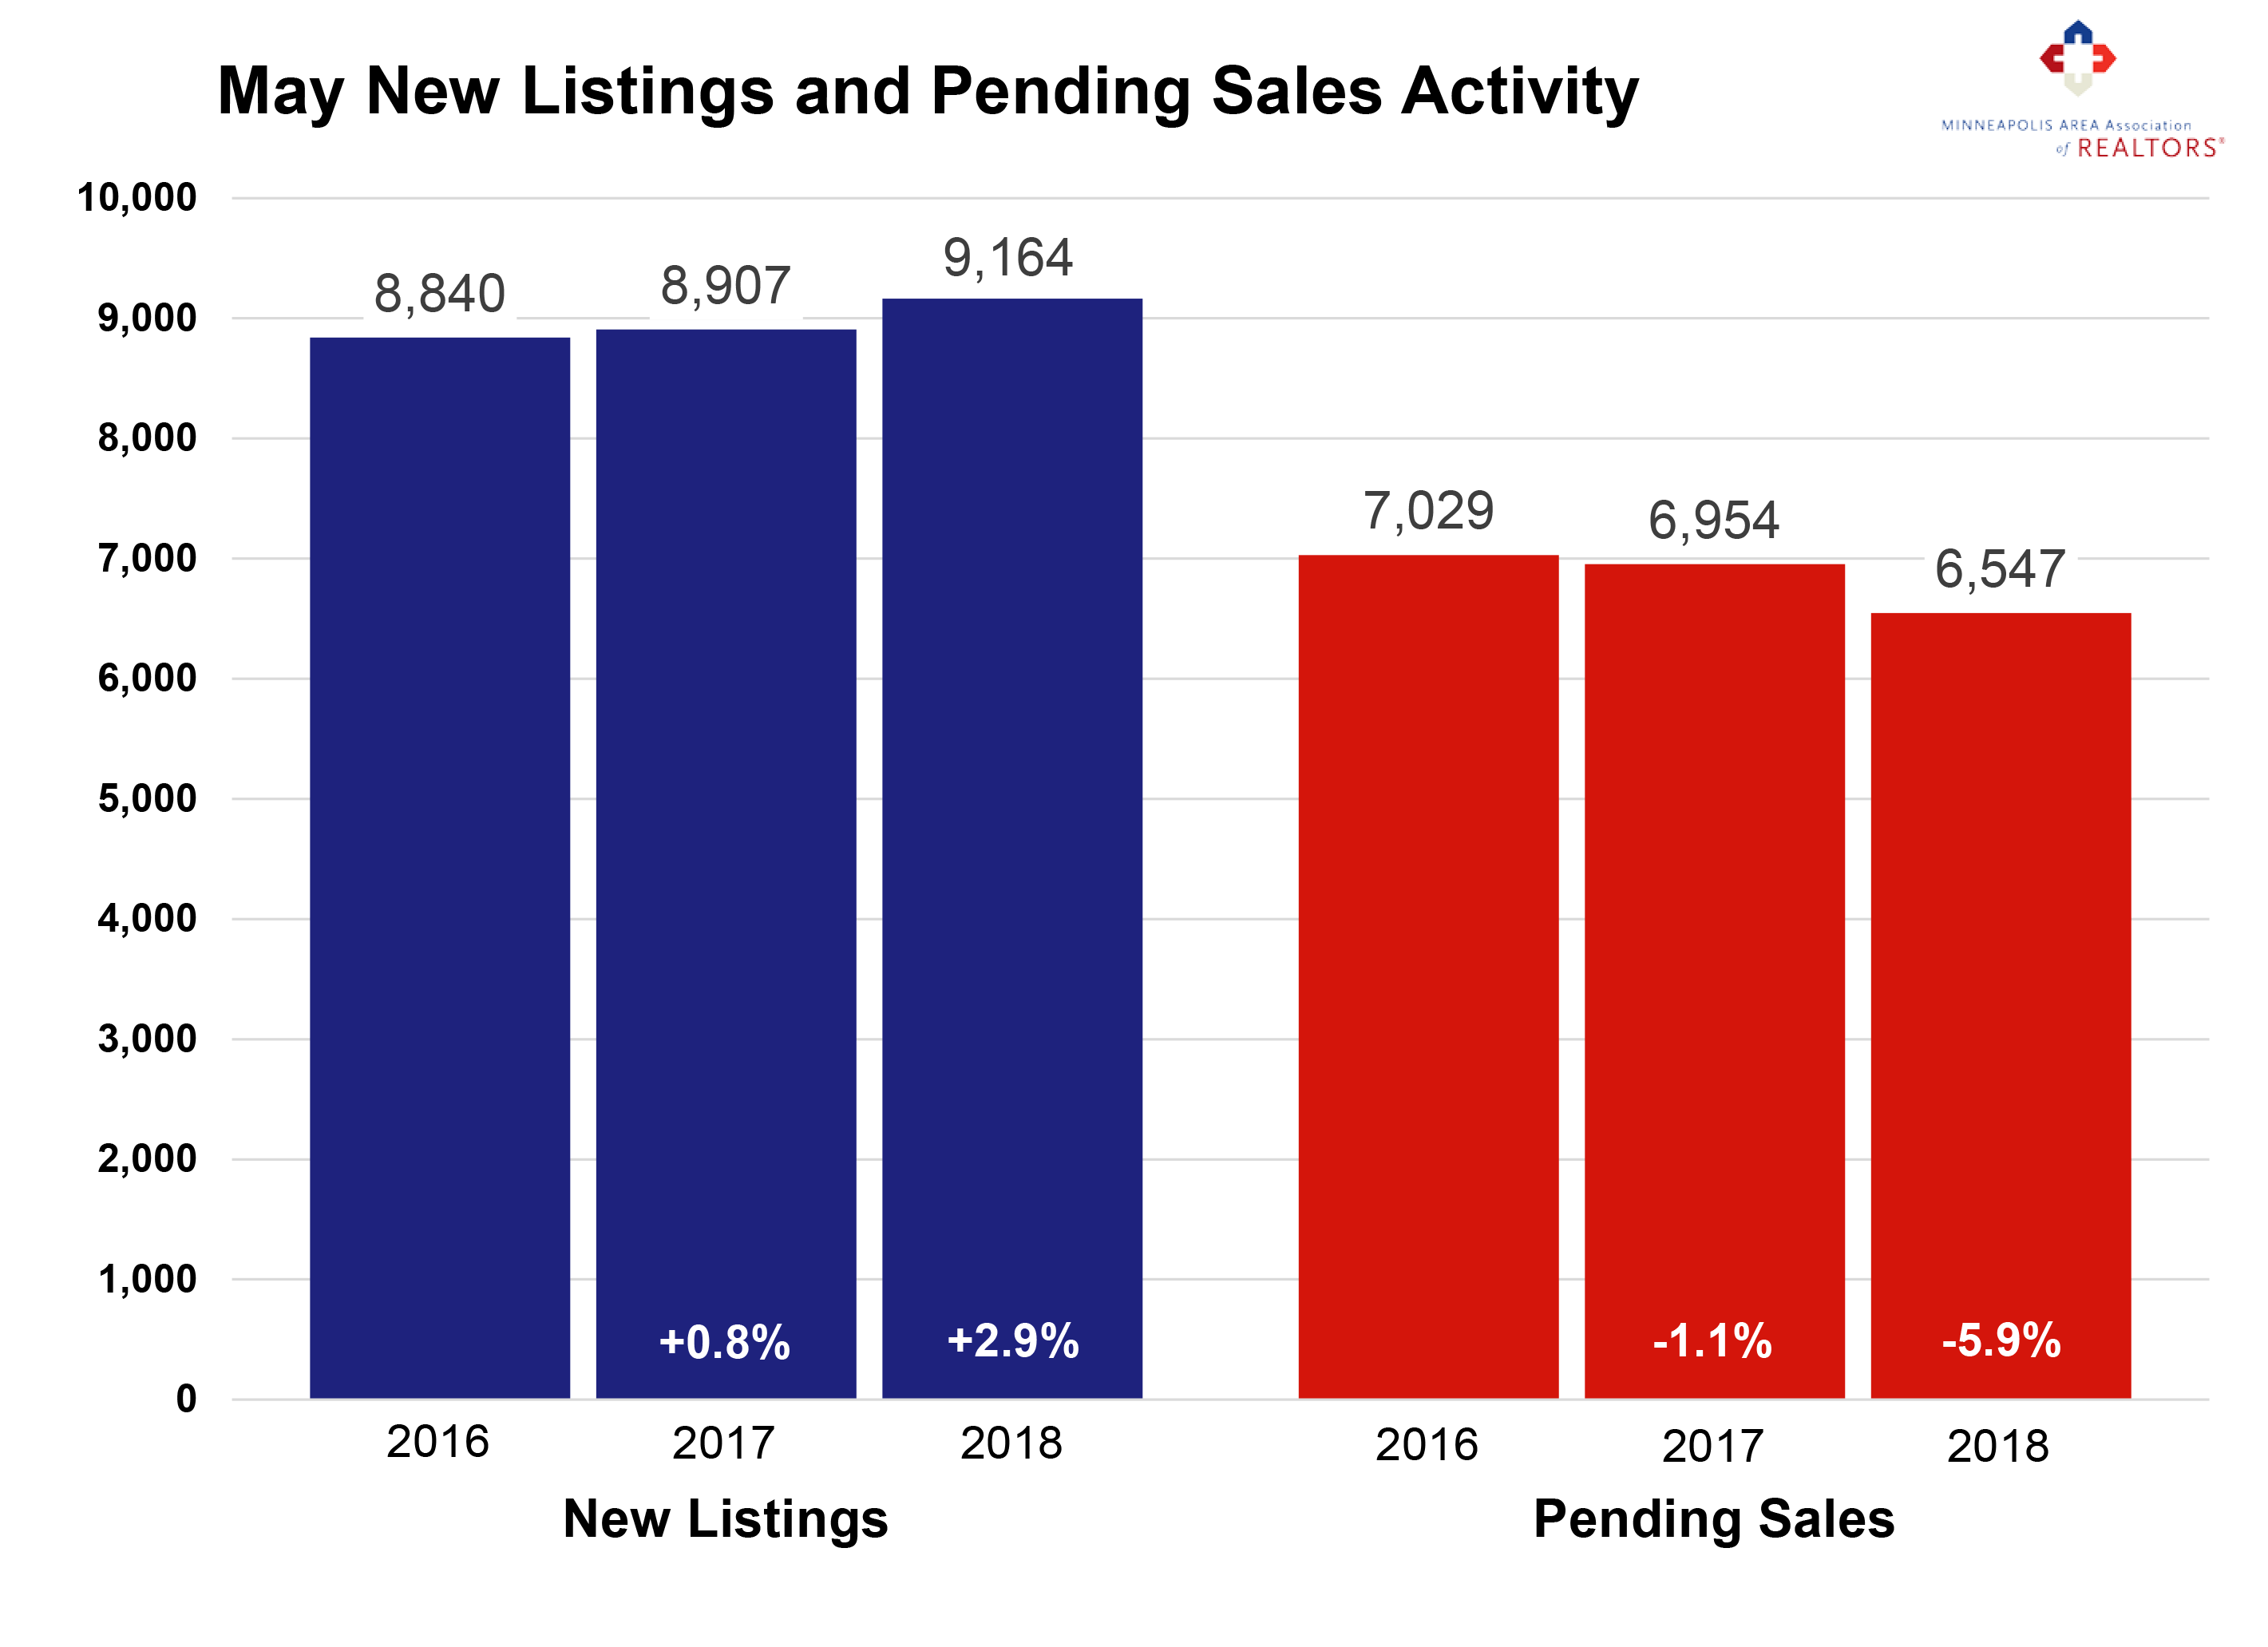
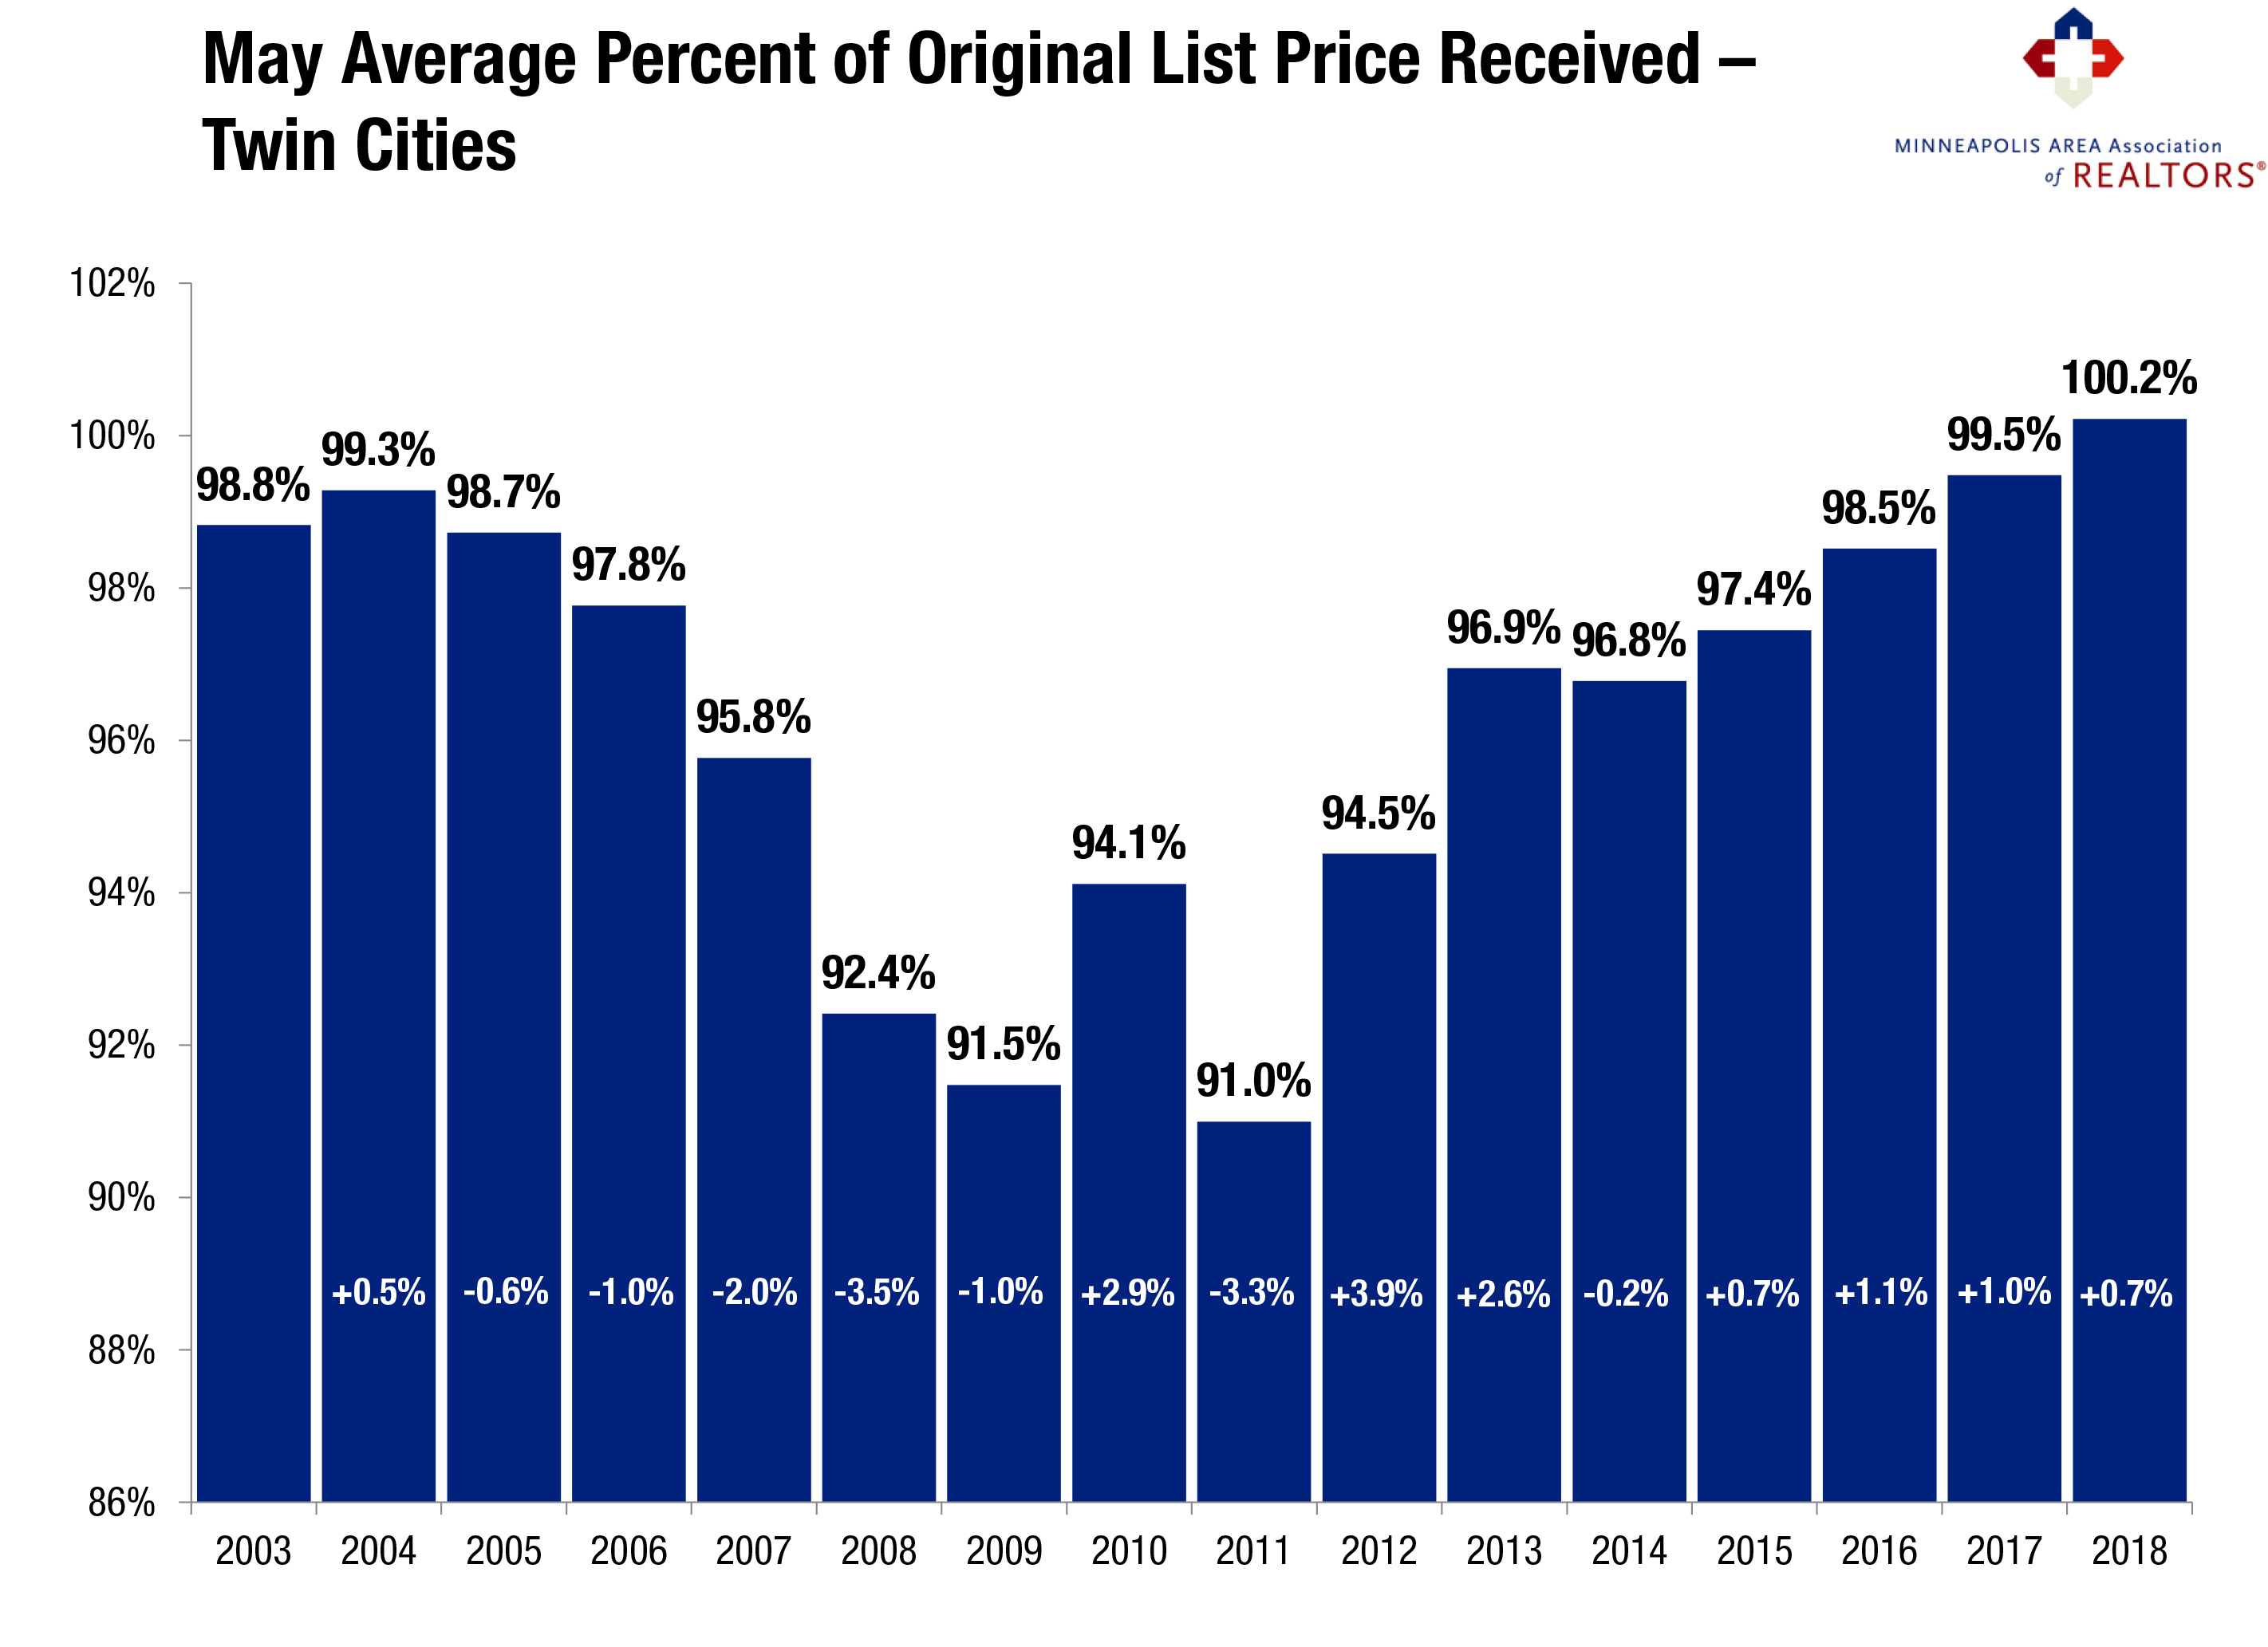
More sellers may finally be jumping into the market at a time when buyers are facing the challenges of low inventory. Since 2013, new listing activity has been subdued relative to buyer activity and hasn’t surpassed 9,000 new listings per month since 2010. Excluding 2010, we haven’t had this many new listings for any month since May 2008. Increasing seller activity and tapering demand are consistent with a marketplace that’s starting to loosen up just a bit. That said, buyers shopping this spring and summer will still face stiff competition. Being successful in this market takes commitment, decisiveness and persistence—traits not necessarily typical of every buyer. In fact, May marked the sixth consecutive month of year-over-year declines in closed sales, likely reflecting the lack of homes for sale and not weakness in the economy. Strong demand combined with low supply means sellers yielded an average of 100.2 percent of their list price in May, a record high for any month and the first time this indicator has exceeded 100.0 percent. The shortage is especially noticeable at the entry-level prices, where multiple offers and homes selling for over list price have become increasingly common. Homes continue to sell quickly and for close to or above list price in this tight market, but nearly 12,000 buyers and sellers managed to transact real property last month.

May 2018 by the Numbers (compared to a year ago)

Sellers listed 9,164 properties on the market, a 2.9 percent increase
Buyers closed on 5,739 homes, a 11.3 percent decrease
Inventory levels for May fell 17.8 percent compared to 2017 to 10,403 units
Months Supply of Inventory was down 16.0 percent to 2.1 months
The Median Sales Price rose 8.4 percent to $271,000, a record high
Cumulative Days on Market declined 9.6 percent to 47 days, on average (median of 17)
Changes in Sales activity varied by market segment

Single family sales sank 12.3 percent; condo sales fell 3.5 percent; townhome sales declined 7.5 percent
Traditional sales fell 9.7 percent; foreclosure sales sank 38.1 percent; short sales plummeted 59.7 percent
Previously-owned sales fell 12.4 percent; new construction sales rose 11.1 percent

From The Skinny Blog.

The Skinny

Long-Term Price Trend

By David Arbit on Tuesday, June 12th, 2018

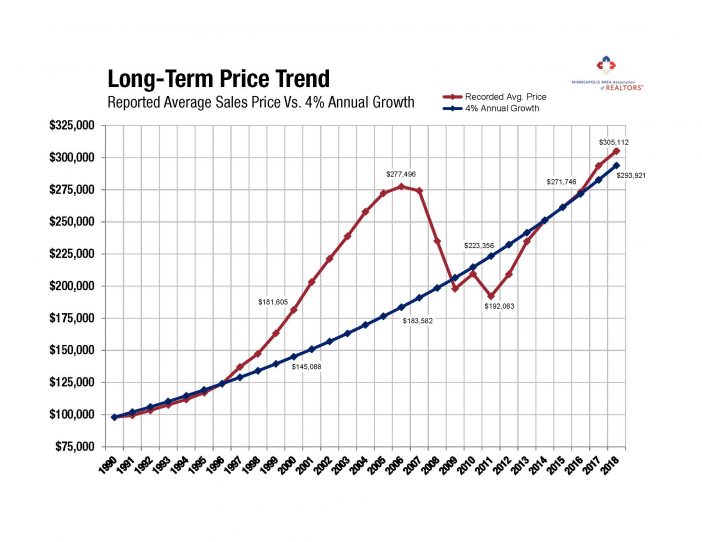
Have you ever wondered to yourself what the home price trendline would look like compared to a hypothetical trendline that starts at the same price in 1990 but increased at a steady and predictable 4% annual growth? Well you’re in luck, because that’s exactly the sort of in-depth market insights that we serve up on a regular basis.

As you can see, recorded average sales prices were well above their trend from 1997 through 2008. The gravity or weight behind the long-term average has an inescapable pull. Some call this return to the average a “reversion to the mean.” There will always be short-term market fluctuations, but the overall long-term direction and growth of the market is upward at around 4-5% per year (before inflation). When we use the 4% figure, prices are only slightly above trend. If we were to use the 5% figure, prices would appear drastically undervalued relative to their long-term average.

The truth, as always, is somewhere in the middle.

*(Note that 2018 data is year-to-date up through April)
From The Skinny Blog.

The Skinny

Slightly less activity yet higher prices in less time

By David Arbit on Tuesday, May 22nd, 2018

Housing demand is strong and supply is low. That’s been the story for a few years. But there is some early evidence that things could be starting to loosen up. That said, buyers shopping this spring will still face stiff competition. The lack of inventory combined with rising prices is encouraging some sellers to stay put; however, the move up market offers a bit more inventory. This combined with historically low interest rates creates a perfect opportunity for homeowners looking to move up.

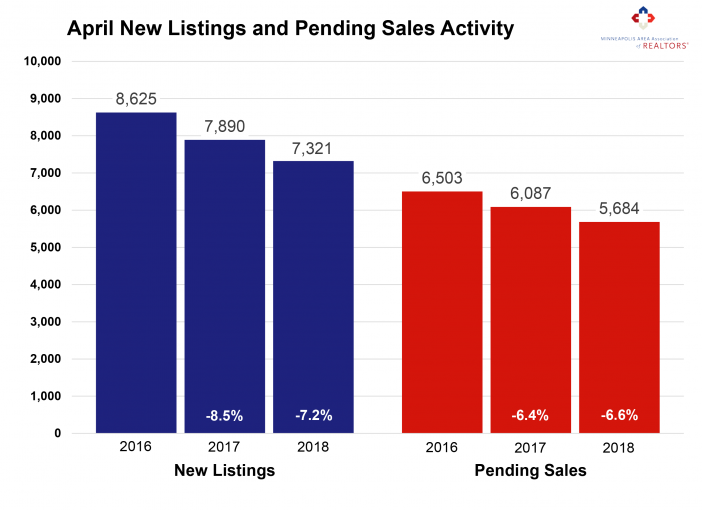
In April, sellers listed 7.2 percent fewer homes on the market—the sixth consecutive month of declines compared to a year ago. Largely due to the shortage, closed sales declined 5.2 percent compared to the prior year. For-sale housing inventory was 25.1 percent lower than April 2017. This shortage, which is particularly acute at the entry-level prices, has created a competitive environment where multiple offers and homes selling for over list price have become more common. Sellers are often receiving strong offers close to their original list price quickly, which can sometimes frustrate home buyers.

New construction closed sales rose 13.2 percent compared to last April. Although single family homes made up about 73.0 percent of all sales, townhomes and condos have seen stronger demand lately. Similarly, previously-owned homes made up about 90.0 percent of sales, but new construction showed a much stronger increase in pending and closed purchase activity. The average time on market is still 53 days, reminding sellers that they still need to stage and price their homes well.

April 2018 by the Numbers (compared to a year ago)
• Sellers listed 7,321 properties on the market, a 7.2 percent decrease
• Buyers closed on 4,635 homes, a 5.2 percent decrease
• Inventory levels for April fell 25.1 percent compared to 2017 to 8,958 units
• Months Supply of Inventory was down 25.0 percent to 1.8 months
• The Median Sales Price rose 8.6 percent to $266,000, a record high for April
• Cumulative Days on Market declined 10.2 percent to 53 days, on average (median of 18)
• Changes in Sales activity varied by market segment

Single family sales declined 6.4 percent; condo sales rose 3.0 percent; townhome sales rose 1.0 percent
Traditional sales fell 2.8 percent; foreclosure sales decreased 43.3 percent; short sales fell 20.0 percent
Previously-owned sales fell 5.6 percent; new construction sales rose 13.2 percent

From The Skinny Blog.

The Skinny

Mixed Spring: Activity cools while prices, market times remain hot

By David Arbit on Wednesday, April 18th, 2018

From colder-than-average temperatures to a record-breaking snow storm, this spring has been anything but normal. While those searching for homes have seen more options since January or February, they’re still seeing fewer options compared to last year. That’s capped sales activity—particularly at the entry-level prices—and the lack of inventory combined with rising prices is encouraging some sellers to hold onto their properties.

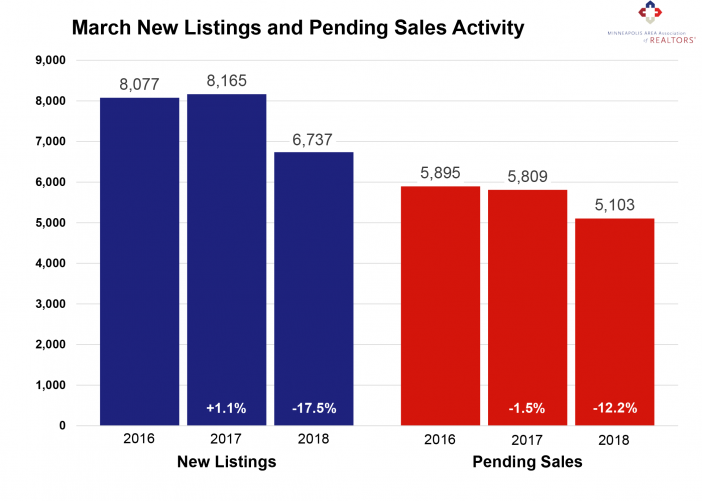
In March, sellers listed 17.5 percent fewer homes on the market—the fifth consecutive month of declines compared to a year ago. Largely due to the shortage, closed sales declined 10.3 percent compared to the year prior. For-sale housing inventory was 26.1 percent lower than March 2017, the largest decline in over a year. This shortage has created a competitive environment where multiple offers and homes selling for over list price have become more common.

Sellers are receiving strong offers close to their original list price quickly, which can sometimes frustrate home buyers. New construction closed sales rose 13.1 percent compared to last March. Although single family homes made up about 74.0 percent of all sales, townhomes have enjoyed more resilient demand lately. Similarly, previously-owned homes made up about 89.0 percent of sales but new construction showed a much stronger increase in pending and closed purchase activity.

“We’re seeing some early evidence that the seller’s market could be starting to shift toward a balanced market,” said Kath Hammerseng, President of the Minneapolis Area Association of REALTORS® (MAAR), “When it comes to the long-term health of the housing market, that’s very much a good thing.”

March 2018 by the Numbers (compared to a year ago)

  • Sellers listed 6,737 properties on the market, a 17.5 percent decrease
  • Buyers closed on 3,978 homes, a 10.3 percent decrease
  • Inventory levels for March fell 26.1 percent compared to 2017 to 8,289 units
  • Months Supply of Inventory was down 22.7 percent to 1.7 months
  • The Median Sales Price rose 9.8 percent to $258,000, a record high for March
  • Cumulative Days on Market declined 21.9 percent to 57 days, on average (median of 22)
  • Changes in Sales activity varied by market segment:
    • Single family sales fell 9.8 percent; condo sales declined 10.0 percent; townhome sales shrank 9.6 percent
    • Traditional sales fell 7.5 percent; foreclosure sales decreased 39.3 percent; short sales fell 47.3 percent
    • Previously-owned sales fell 11.4 percent; new construction sales rose 13.1 percent

    “Prices continue to rise while market times remain brisk,” said Todd Urbanski, President-Elect of MAAR. “This spring market is shaping to be more buyer-friendly than last year, it’s still a great time to get properties listed.”

    From The Skinny Blog.

The Skinny

Sales down in early spring market while prices rally

By David Arbit on Friday, March 16th, 2018

The big story of 2017 was threefold: the median sales price reached an all-time high; closed sales reached a 12-year high; and inventory levels reached a 15-year low. Sales nearly broke their all-time record, but fell just short of their all-time 2004 high. In February 2018, new listings posted a year-over-year decline for a fourth consecutive month. Mostly due to the supply shortage, closed sales were lower compared to the year prior for a third consecutive month. For-sale housing supply (inventory) was 23.0 percent lower than February 2017. This shortage has created a competitive environment where multiple offers have become commonplace. Sellers are receiving strong offers close to their original list price in record time, which can sometimes frustrate home buyers. New construction closed sales rose 15.7 percent compared to last February. Although single-family homes made up about 73.0 percent of all sales, condos and townhomes showed the strongest increase in closed sales. Similarly, previously-owned homes made up about 88.7 percent of sales but new construction showed a much stronger increase in pending and closed purchase activity.

February 2018 by the Numbers

  • Sellers listed 5,072 properties on the market, an 8.0 percent decrease from February 2017
  • Buyers closed on 2,635 homes, a 6.0 percent decrease from 2017
  • Inventory levels for February fell 23.0 percent compared to 2017 to 7,537 units, near a 15-year low
  • Months Supply of Inventory was down 21.1 percent to 1.5 months, also near a 15-year low
  • The Median Sales Price rose 12.7 percent to $250,000, a record high for February
  • Cumulative Days on Market declined 15.9 percent to 69 days, on average (median of 38)—a 12-year low
  • Changes in sales activity varied by market segment
    • Single-family sales fell 8.3 percent; condo sales rose 1.9 percent; townhome sales rose 6.3 percent
    • Traditional sales fell 1.3 percent; foreclosure sales fell 43.3 percent; short sales fell 39.6 percent
    • Previously-owned sales fell 6.3 percent; new construction sales rose 15.7 percent

From The Skinny Blog.

The Skinny

Sluggish start to 2018 after a record 2017

By David Arbit on Friday, February 16th, 2018

The big story of 2017 was threefold: the median sales price reached an all-time high; closed sales reached a 12-year high; and inventory levels reached a 15-year low. Sales nearly broke their all-time record, but fell just 12 units short of their all-time 2004 high. In January 2018, new listings posted a year-over-year decline for a third consecutive month. Because of the supply shortage, closed sales were lower compared to the year prior for a second consecutive month. For-sale housing supply (inventory) was about a quarter lower than January 2017. This shortage has created a competitive environment where multiple offers have become commonplace. Sellers are receiving strong offers close to their original list price in record time, which can sometimes frustrate home buyers. New construction pending sales rose nearly 14.0 percent compared to last January. Although single-family homes made up about 76.0 percent of all sales, townhomes were the only segment to show an increase in pending sales. Similarly, previously-owned homes made up about 91.0 percent of sales but new construction showed a much stronger increase in pending purchase activity.

January 2018 by the Numbers

• Sellers listed 4,041 properties on the market, a 7.8 percent decrease from January 2017
• Buyers closed on 2,758 homes, a 4.4 percent decrease from 2017
• Inventory levels for January fell 26.3 percent compared to 2017 to 6,875 units, near a 15-year low
• Months Supply of Inventory was down 27.8 percent to 1.3 months, a 15-year low
• The Median Sales Price rose 9.6 percent to $243,750, a record high for January
• Cumulative Days on Market declined 13.8 percent to 69 days, on average (median of 45)—a 12-year low
• Changes in sales activity varied by market segment

    o Single-family sales fell 1.3 percent; condo sales fell 15.1 percent; townhome sales fell 8.5 percent
    o Traditional sales fell 1.7 percent; foreclosure sales fell 21.8 percent; short sales fell 42.4 percent
    o Previously-owned sales fell 3.8 percent; new construction sales fell 0.4 percent

From The Skinny Blog.

The Skinny

Home Prices Reach Record High; Home Sales Reach 12-year High

By David Arbit on Wednesday, January 24th, 2018

2017 Annual Wrap-Up:
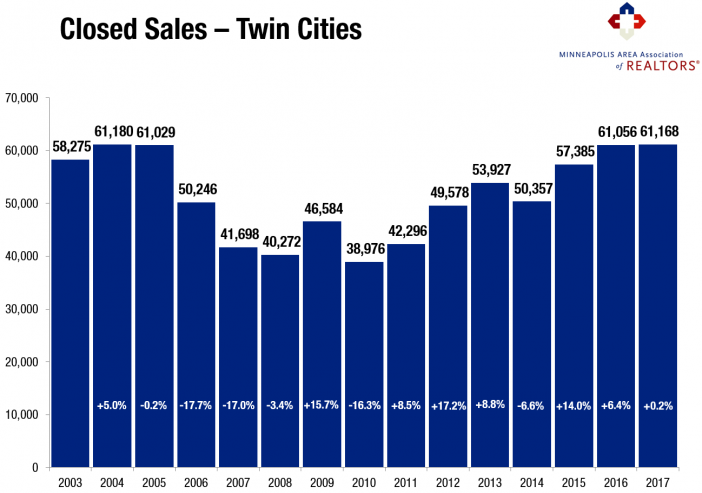
The big story of 2017 was threefold: the median sales price reached an all-time high; closed sales reached a 12-year high; and inventory levels reached a 15-year low. Sales nearly broke their all-time record, but fell just 12 units short of their all-time 2004 high. Seller activity declined slightly for a second year. Near-record sales activity combined with weaker seller activity exacerbated the supply shortage. For-sale housing supply fell to a 15-year low. This shortage has created a competitive environment where multiple offers have become more common. Sellers are receiving strong offers in record time, but this fast-paced market can frustrate some consumers. Days on market fell to an 11-year low. Absorption rates fell to 1.4 months of supply at year-end, also a 15-year record low. Foreclosure activity fell for a sixth straight year and is back below 2007 levels. Although single-family homes made up about 75.0 percent of all sales, both townhomes and condos showed a stronger increase in sales. Similarly, previously-owned homes made up about 93.0 percent of sales but new construction showed a much stronger increase.

2017 by the Numbers
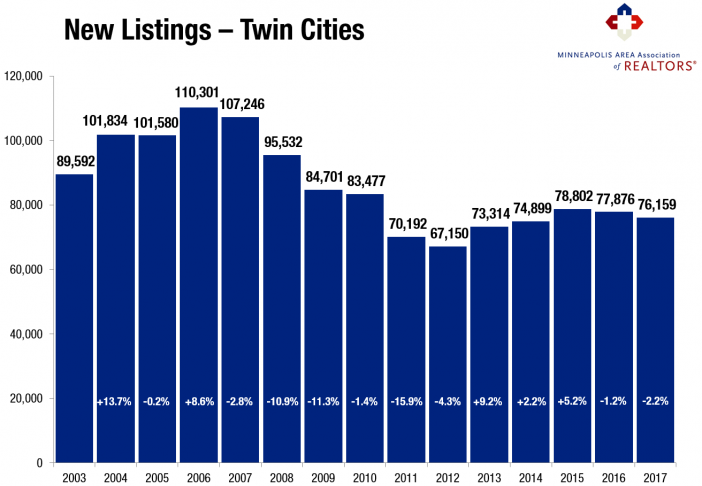
• Sellers listed 76,159 properties on the market, a 2.2 percent decrease from 2016
• Buyers closed on 61,168 homes, a 0.2 percent increase from 2016 and the highest figure since 2004
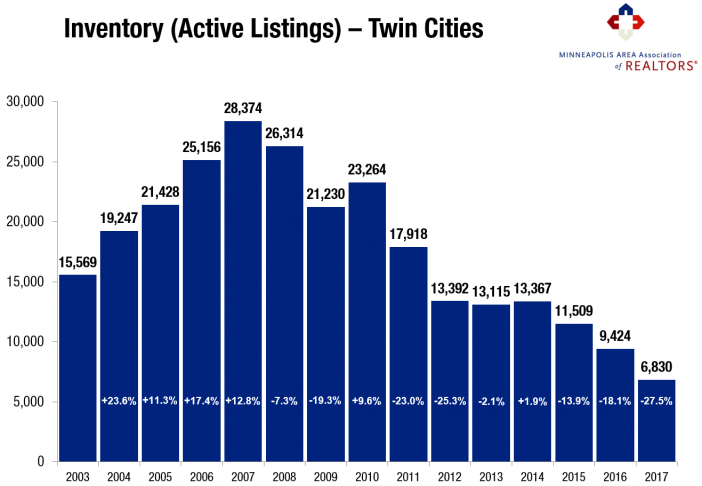
• Inventory levels for December fell 27.5 percent compared to 2016 to 6,830 units, a 15-year low
• Months Supply of Inventory was down 26.3 percent to 1.4 months, also a 15-year low
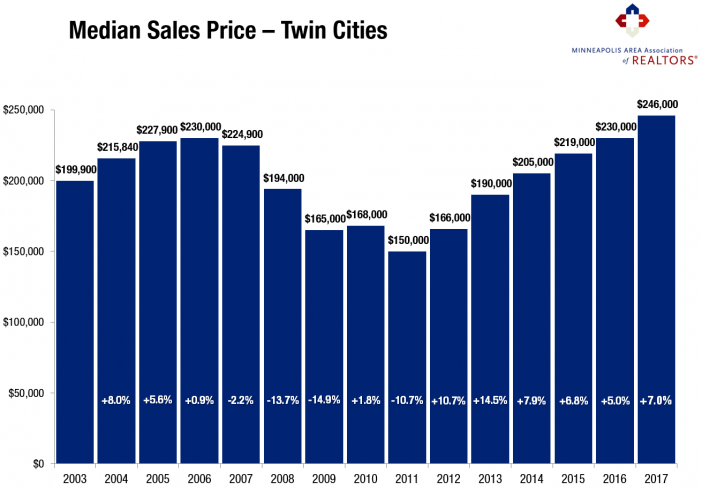
• The Median Sales Price rose 7.0 percent to $246,000, which is an all-time record high
• Cumulative Days on Market declined 13.8 percent to 56 days, on average (median of 27)—an 11-year record low
• Changes in sales activity varied dramatically by market segment:

Single-family sales decreased 1.1 percent; condo sales rose 2.0 percent; townhome sales rose 5.7 percent
Traditional sales rose 3.7 percent; foreclosure sales fell 42.8 percent; short sales fell 49.9 percent
Previously-owned sales declined 0.7 percent; new construction sales rose 13.9 percent

“It was an interesting year in a lot of ways. In addition to record prices and near-record sales, the inventory shortage and some affordability concerns also took center stage. Our region is extremely high-performing when it comes to homeownership, employment, education and quality of life. That said, as some market challenges get resolved, expect homeownership to remain an attractive opportunity moving forward,” said Kath Hammerseng, president of the Minneapolis Area Association of REALTORS®.

Sellers posted their second consecutive decrease in activity. New listings were down a slight 2.2% compared to 2016. Many sellers are still motivated by rising prices and quick market times, some sellers have decided to wait it out, enjoy the ride up and hope for more inventory choices before they list their home for sale.

Buyers were active in 2017. Closed sales reached a 13-year high and were within 12 sales of breaking their all-time record from 2004. Encouraged by low interest rates, rising rents and an improving economy, housing demand was exceptionally strong. These gains were driven by more activity in the higher price brackets, as well as increases in condo-townhomes and new construction.

With supply levels at 15-year lows and demand indicators at 12-year highs, the median sales price rose 7.0 percent to $246,000. This marks an all-time record high. Home prices have risen 64.0% from their low point in 2011. Rising prices boost equity, motivate reluctant sellers and replenish local tax base, but can also harm affordability if incomes don’t keep pace.

Inventory levels fell 27.5% to a 15-year low. Consumers had 6,830 options to choose from in December but over 13,400 in July. When combined with strong demand, this supply-side constraint has resulted in competitive bidding on some listings. This shortage has frustrated some buyers. Replenishing supply levels is critical to sustained market health as well as to maintaining a spectrum of housing opportunity for all buyers.

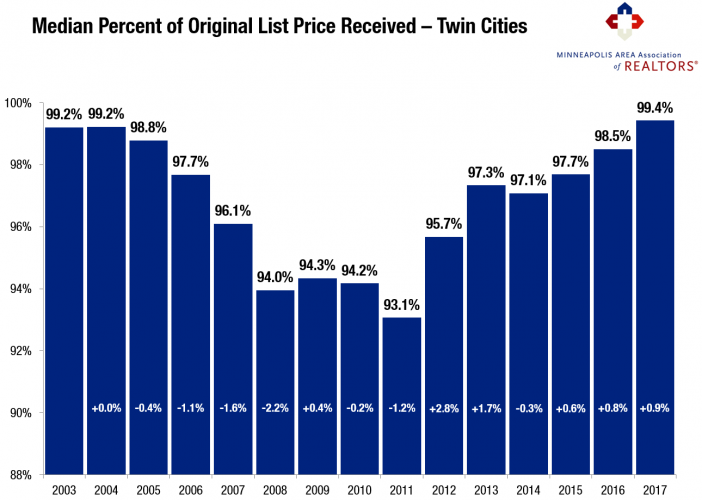
Mostly due to fundamentals but also better pricing decisions, sellers yielded a higher share of their asking price. The median percent of original list price received reached a record high of 99.4 percent. Sellers had a 50/50 chance of receiving more than their current list price. The landscape for sellers has improved immensely. Most sellers can expect to receive offers very close to their list price.

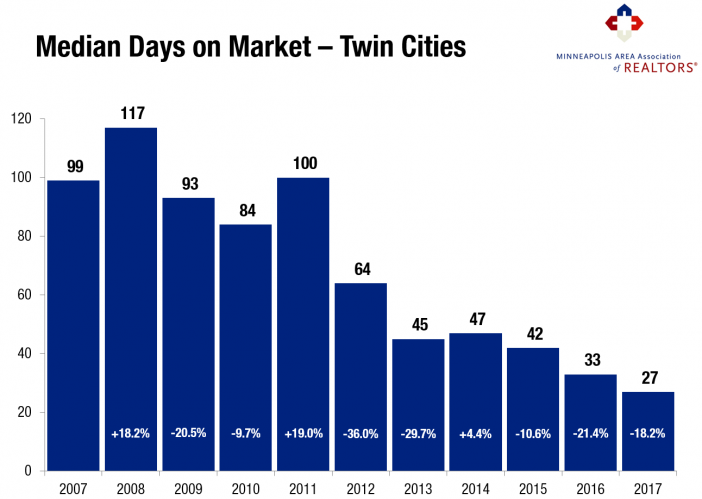
Homes are selling at an 11-year record pace. Listings spent a median of 27 days on the market, 18.3 percent fewer than in 2016. That is less than half the market time from 2012 and nearly a quarter of the market time from 2011. Among other trends, the fact that homes are selling in less time at higher price points should reinforce seller confidence. That’s motivating to sellers, and our market is thirsty for additional inventory.

From The Skinny Blog.

The Skinny

  • « Previous Page
  • 1
  • …
  • 31
  • 32
  • 33
  • 34
  • 35
  • …
  • 40
  • Next Page »

Follow Me

  • Dribbble
  • Facebook
  • LinkedIn
  • YouTube

Contact ME

All information deemed reliable but not guaranteed and should be independently verified.

Powered By WordPress | © 2026Migthy Agent LLC