For Week Ending October 9, 2021
As home prices have continued to soar, many borrowers are finding they must borrow more to afford the rising costs of homeownership. Applications for jumbo loans — those loans that exceed conventional conforming loan limits established by the Federal Housing Finance Agency — are on the rise, and could reach $550 billion this year, according to Bank of America researchers, the highest level since before the 2008 financial crisis.
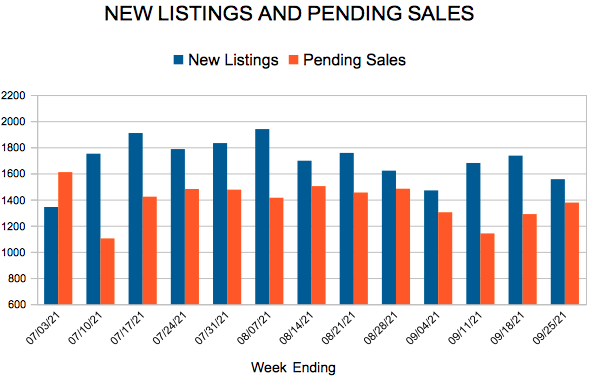
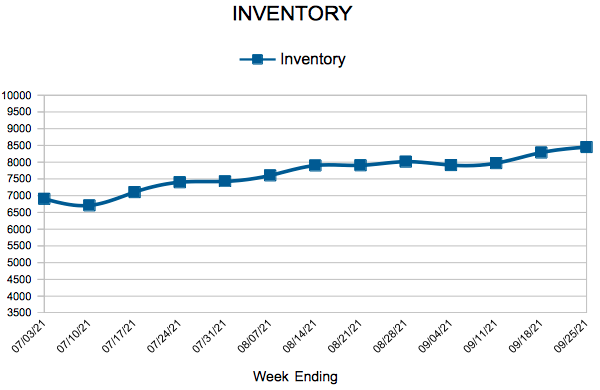
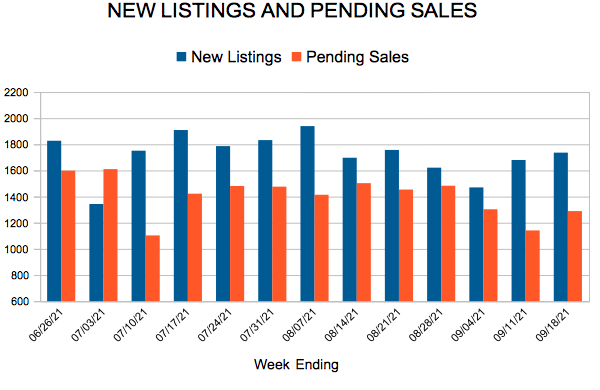
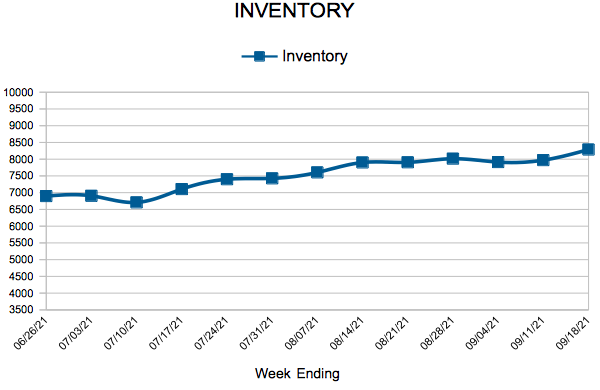
In the Twin Cities region, for the week ending October 9:
- New Listings decreased 16.4% to 1,476
- Pending Sales decreased 5.8% to 1,335
- Inventory decreased 15.6% to 8,251
For the month of September:
- Median Sales Price increased 10.0% to $341,000
- Days on Market decreased 37.8% to 23
- Percent of Original List Price Received increased 0.7% to 101.2%
- Months Supply of Homes For Sale decreased 21.1% to 1.5
All comparisons are to 2020
Click here for the full Weekly Market Activity Report. From MAAR Market Data News.