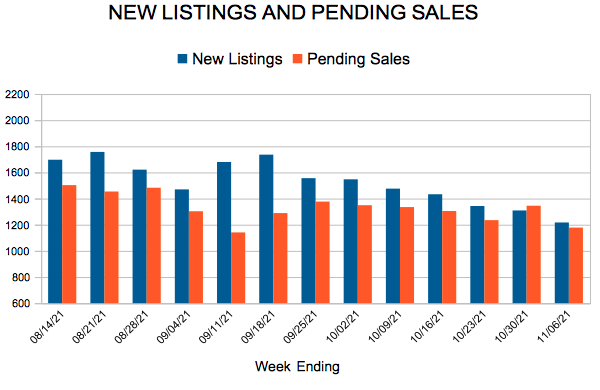
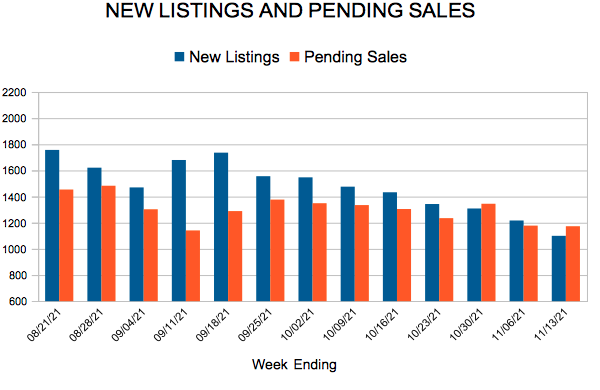
New Listings and Pending Sales

 For Week Ending November 20, 2021
Consumer credit scores have risen since the beginning of the pandemic, according to FICO CEO William Lansing in a recent interview with MarketWatch. The average score across all segments rose eight points to 716, while consumers with scores below 600 saw a larger average increase, rising from 581 in April 2020 to 601 today. Pandemic-related relief programs and a decrease in consumer spending early in the pandemic are likely contributors to the improvement in scores. Higher credit scores can offer home buyers more loan options as well as lower interest rates, which can increase affordability and purchasing power.
IN THE TWIN CITIES REGION, FOR THE WEEK ENDING NOVEMBER 20:
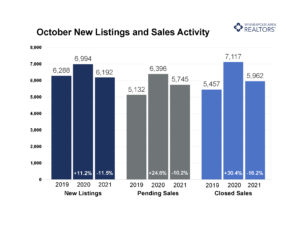
FOR THE MONTH OF OCTOBER:
All comparisons are to 2020
Click here for the full Weekly Market Activity Report. From MAAR Market Data News.
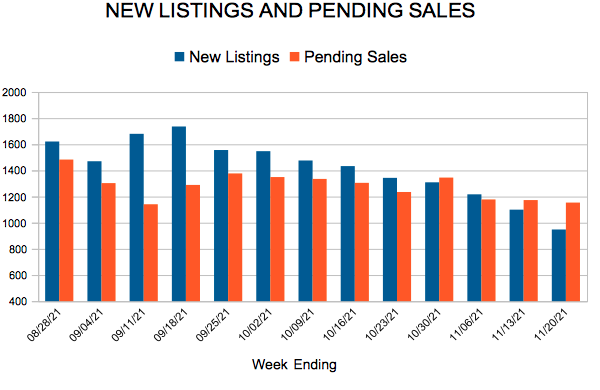
 For Week Ending November 13, 2021
The Federal Housing Finance Agency may soon increase conforming loan limits, according to the Wall Street Journal, with Fannie Mae and Freddie Mac expected to back mortgage loans close to $1 million dollars in high-cost markets, and loans up to $650K in other markets, beginning in 2022. The final loan limits are expected to be announced November 30th. The projected increases are meant to keep pace with the historic rise of sales prices in the last year. Conforming loans often offer lower interest rates and smaller down payments, making it more affordable and easier for some borrowers to purchase a home.
IN THE TWIN CITIES REGION, FOR THE WEEK ENDING NOVEMBER 13:
FOR THE MONTH OF OCTOBER:
All comparisons are to 2020
Click here for the full Weekly Market Activity Report. From MAAR Market Data News.
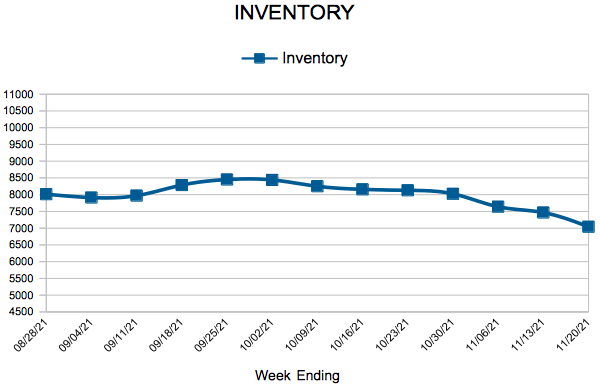
Months’ supply of inventory was down 23.5 percent to 1.3 months. A balanced market is about 5-6 months of supply. 1.3 months of supply indicates a pretty extreme sellers’ market.
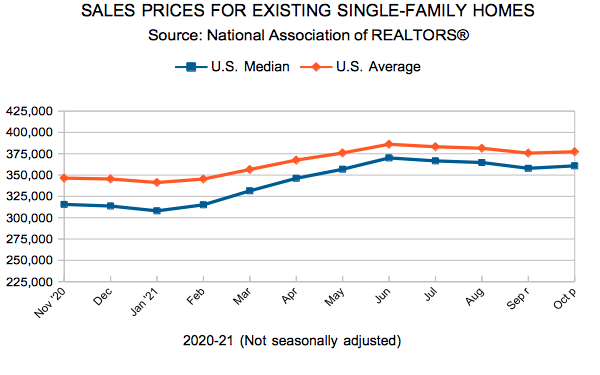
(November 16, 2021) – According to new data from Minneapolis Area REALTORS® and the Saint Paul Area Association of REALTORS®, the median sales price in the Twin Cities rose 7.9 percent from October 2020 to $340,000. Despite the housing shortage, price growth is returning to more typical levels even as we mark 10 full years of a sellers’ market.
New listings in the metro fell 11.5 percent from last October and are 1.5 percent below their 2019 level. While pending sales also dipped 10.2 percent from last year, buyer activty is up 11.9 percent from 2019. Closed sales were also down from 2020 but up from 2019. Last month also marked the Twin Cities’ 10th straight year in a metro-wide seller’s market. We’ve had under 5.0 months supply of inventory for every month of every year since November 2011. Over the last year, however, we’ve seen those absorption rates contract to 1.0 month of supply. Six months of supply is considered a balanced market. The three primary drivers of this is strong demand, weak listing activity and tight inventory levels.
“We’re still stuck in this period of apples-to-oranges year-over-year comparisons where we’re up against a uniquely strong pandemic market,” said Todd Walker, President of Minneapolis Area REALTORS®. “And as inflation concerns grow, cash downpayment savings can lose value. As rates rise, it’s possible some buyers move up their purchase timeline.” As we embrace fall and begin to cool down seasonally, listings tend to take longer to sell than in spring or summer. Half of the listings in the metro area sold in fewer than 14 days. While that pace is flat from last year, time on market is down 44.0 percent from 2019, and 14 days is a record fast pace for any October going back to 2007 and likely earlier. Sellers accepted, on average, 100.3 percent of their list price, down slightly from last October.
Inventory levels were down 16.2 percent compared to a 40.5 percent decline back in May. “Pricing has remained firm from all the demand still in the market as well as the supply squeeze,” according to Tracy Baglio, President of the Saint Paul Area Association of REALTORS®. “While still rising, the rate of year-over-year price growth has slowed from 16.6 percent in May to around 8.0 percent last month.”
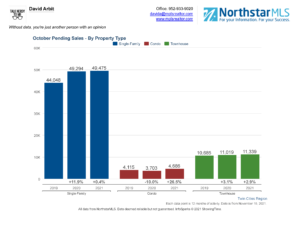
Market activity varies by area, price point and property type. Home sales more than doubled in Loring Park and Bryant and doubled in the Folwell and Lyndale neighborhoods, but fell between 60.0 and 80.0 percent in Kenwood, Kenny and Armatage. Sales in Centerville rose 83.3 percent and 46.7 percent in Princeton but fell 71.4 percent in Wayzata and 61.3 percent in New Prague. The price range with the largest gain in demand was the $1M+ luxury sector, where sales have surged 47.3 percent over the last 12 months. Sales between $150,000 and 190,000 dropped 30.1 percent. In August, closed sales in Minneapolis reached their highest level since 2005, marking a 16-year high for housing demand in the city. Though a small share overall, condo sales rose more than any other property type over the last year.
October 2021 by the numbers compared to a year ago
All information is according to the Minneapolis Area REALTORS® and Saint Paul Area Association of REALTORS based on data from NorthstarMLS. We serve the Twin Cities 16-county metro area and western Wisconsin.