For Week Ending November 13, 2021
The Federal Housing Finance Agency may soon increase conforming loan limits, according to the Wall Street Journal, with Fannie Mae and Freddie Mac expected to back mortgage loans close to $1 million dollars in high-cost markets, and loans up to $650K in other markets, beginning in 2022. The final loan limits are expected to be announced November 30th. The projected increases are meant to keep pace with the historic rise of sales prices in the last year. Conforming loans often offer lower interest rates and smaller down payments, making it more affordable and easier for some borrowers to purchase a home.
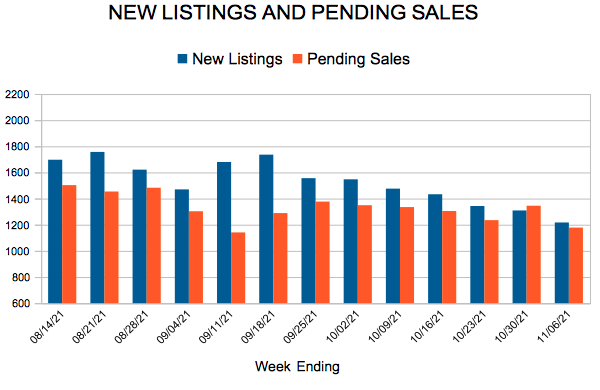
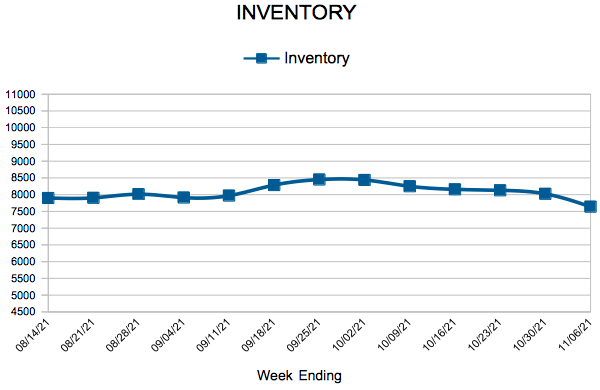
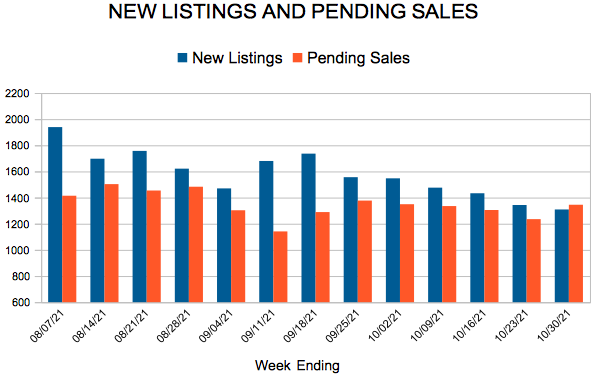
IN THE TWIN CITIES REGION, FOR THE WEEK ENDING NOVEMBER 13:
- New Listings increased 9.3% to 1,100
- Pending Sales increased 2.5% to 1,173
- Inventory decreased 14.3% to 7,466
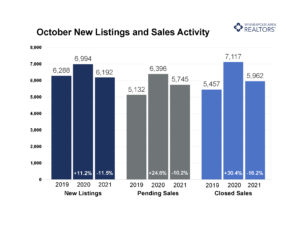
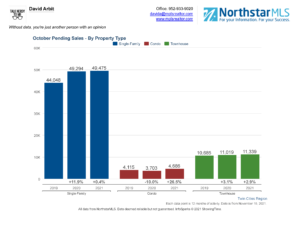
FOR THE MONTH OF OCTOBER:
- Median Sales Price increased 7.9% to $340,000
- Days on Market decreased 22.9% to 27
- Percent of Original List Price Received decreased 0.2% to 100.3%
- Months Supply of Homes For Sale decreased 17.6% to 1.4
All comparisons are to 2020
Click here for the full Weekly Market Activity Report. From MAAR Market Data News.