For Week Ending January 15, 2022
As the U.S. economy recovers from the pandemic, the number of homeowners in forbearance continues to decline, with the total number of loans in forbearance falling to 1.41% as of last measure, making it the first time in 18 months the rate has dropped below 1.5%, according to the Mortgage Bankers Association.
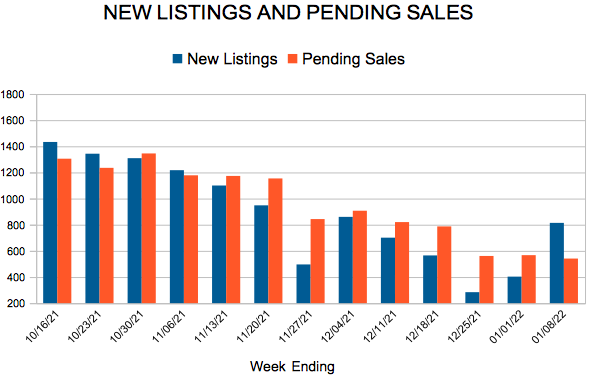
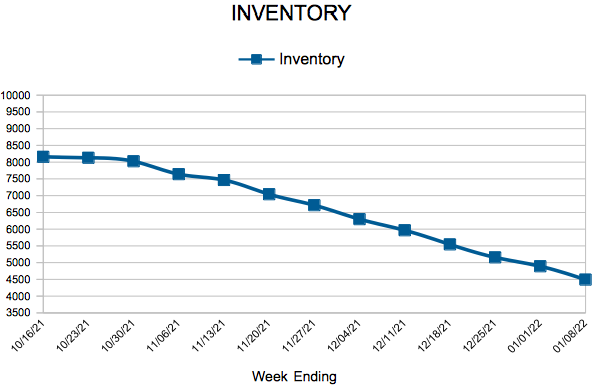
IN THE TWIN CITIES REGION, FOR THE WEEK ENDING JANUARY 15:
- New Listings decreased 18.5% to 790
- Pending Sales decreased 15.0% to 722
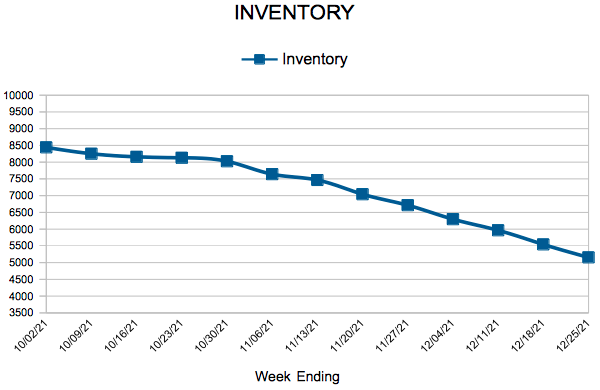
- Inventory decreased 23.2% to 4,463
FOR THE MONTH OF DECEMBER:
- Median Sales Price increased 7.8% to $331,000
- Days on Market decreased 15.4% to 33
- Percent of Original List Price Received decreased 0.2% to 99.5%
- Months Supply of Homes For Sale decreased 27.3% to 0.8
All comparisons are to 2021
Click here for the full Weekly Market Activity Report. From MAAR Market Data News.