- « Previous Page
- 1
- …
- 82
- 83
- 84
- 85
- 86
- …
- 152
- Next Page »
New Listings and Pending Sales
Inventory
Weekly Market Report
 For Week Ending June 11, 2022
To help fight rising inflation, which hit 8.6% as of last measure, the Federal Reserve raised interest rates by three quarters of a percentage point, the largest interest rate hike in 28 years. The U.S. central bank will boost its short-term policy rate to 1.50% – 1.75%, increasing consumer borrowing costs on everything from credit cards to car loans. This marks the third rate increase this year, with the Fed planning additional rate increases throughout the year.
IN THE TWIN CITIES REGION, FOR THE WEEK ENDING JUNE 11:
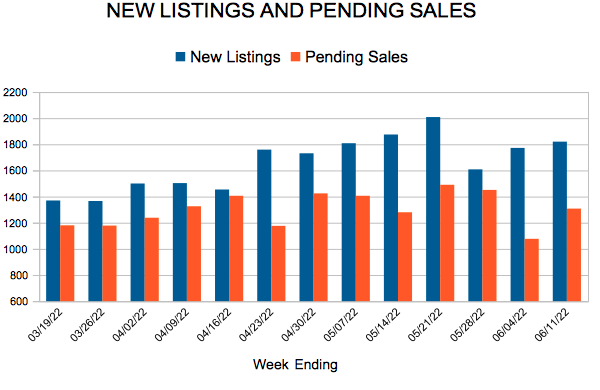
- New Listings decreased 7.7% to 1,820
- Pending Sales decreased 14.6% to 1,308
- Inventory increased 11.7% to 7,429
FOR THE MONTH OF MAY:
- Median Sales Price increased 9.0% to $375,000
- Days on Market decreased 4.2% to 23
- Percent of Original List Price Received increased 0.1% to 104.1%
- Months Supply of Homes For Sale increased 27.3% to 1.4
All comparisons are to 2021
Click here for the full Weekly Market Activity Report. From MAAR Market Data News.
Mortgage Rates Surge on Inflation Expectations
June 16, 2022
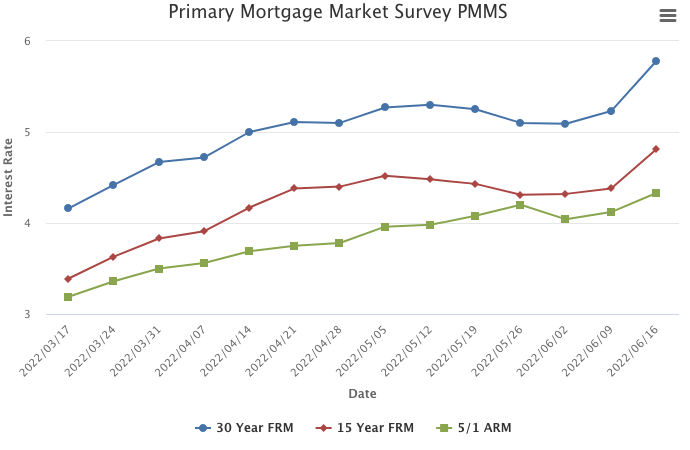
Mortgage rates surged as the 30-year fixed-rate mortgage moved up more than half a percentage point, marking the largest one-week increase in our survey since 1987. These higher rates are the result of a shift in expectations about inflation and the course of monetary policy. Higher mortgage rates will lead to moderation from the blistering pace of housing activity that we have experienced coming out of the pandemic, ultimately resulting in a more balanced housing market.
Information provided by Freddie Mac.
Twin Cities housing supply up for the first time in two years
- There were 6,766 homes on the market at the end of May, 5.3 percent more than May 2021
- Median Sales Price reached a record $375,000, up 9.0 percent from last May
- Pending Sales were down 11.8 percent from last year’s May peak
(June 16, 2022) – According to new data from Minneapolis Area REALTORS® and the Saint Paul Area Association of REALTORS®, the Twin Cities metro area ended the month of May with 6,797 homes, 5.3 percent more homes than last May. This is the first year-over-year inventory increase since March of 2020.
Home Prices & Inventory
Inventory growth in the Twin Cities real estate market has been rare over the last 13 years. Despite record sales in 2021, home buyers were met with fewer listings from which to choose. Since the Great Recession, there have only been three periods with multiple consecutive months of year-over-year supply growth. If continued, the 5.3 percent inventory growth in May could hint at a new trend. Meanwhile the median home price rose 9.0 percent to $375,000. While this does amount to a record high, it’s likely June and July will exceed that level. The housing affordability index reacted to higher prices and rates with a reading of 94, meaning the median income was 94.0 percent of the necessary income needed to qualify for the median priced home under current interest rates. Given more listings and fewer sales, a loosening in inventory could cap price gains, but that takes time to play out and prices are unlikely to soften in the short term. Meanwhile, the metro sits at 1.3 month’s supply of inventory, 18.2 percent more than the year prior. A balanced market has four to six months’ supply. “There’s a sense out there that things are rebalancing somewhat,” said Denise Mazone, President of Minneapolis Area REALTORS®. “But it’s important to remember that we have a long way to go before we’re in oversupply territory so prices should remain firm for now.”
Listings & Sales
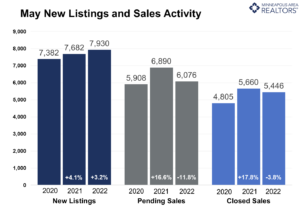
The Twin Cities saw increased seller activity in May for the first time this year—a possible indication of a rebalancing market. New Listings rose 3.2 percent to 7,930 homes last month. Growth in new listings is a contributor to higher inventory levels as is the partly rate-driven decline in buyer activity. Pending sales fell 11.8 percent in May as buyers signed purchase agreements on 6,076 homes. Declining year-over-year demand has been a theme all year since we’ve been comparing to the extremely strong 2021 market. Compared to 2020, pending sales were up 4.8 percent. “We may not have the same frenzy as last year, but REALTORS® are still busy compared to pre-pandemic levels,” according to Mark Mason, President of the Saint Paul Area Association of REALTORS®. “Listings are still selling quickly, even with record prices and higher rates.” Half of all homes went under contract in under 7 days, which is even with the year prior. The good news for sellers is that—despite a cooling in demand—buyers offered 4.1 percent over list price on average, a small increase compared to last May.
Location & Property Type
Market activity varies by area, price point and property type. New home sales rose 6.7 percent while existing home sales were down 3.2 percent. Single family sales fell 4.1 percent, condo sales declined 3.8 percent and townhome sales were up 4.0 percent. Sales in Minneapolis decreased 7.0 percent while Saint Paul sales fell 3.5 percent. Cities like Vadnais Heights, Buffalo, and Champlin saw the largest sales gains while Ramsey, St. Michael, and Andover had lower demand than last year.
May 2022 Housing Takeaways (compared to a year ago)
- Sellers listed 7,930 properties on the market, a 3.2 percent increase from last May
- Buyers signed 6,076 purchase agreements, down 11.8 percent (5,446 closed sales, down 3.8 percent)
- Inventory levels grew 5.3 percent to 6,797 units
- Month’s Supply of Inventory rose 18.2 percent to 1.3 months (4-6 months is balanced)
- The Median Sales Price rose 9.0 percent to $375,000
- Days on Market fell 4.2 percent to 23 days, on average (median of 7 days, even with May 2021)
- Changes in Sales activity varied by market segment
- Single family sales decreased 4.1 percent; Condo sales were down 3.8 percent & townhouse sales rose 4.0 percent
- Traditional sales declined 2.7 percent; foreclosure sales fell 7.9 percent; short sales were up 100.0 percent (from 3 to 6)
- Previously owned sales decreased 3.2 percent; new construction sales increased 6.7 percent
New Listings and Pending Sales
Inventory
Weekly Market Report
 For Week Ending June 4, 2022
The slowdown in the U.S. housing market is causing lumber prices to plummet. Nationally, lumber prices fell 12% the week ending June 3 and are down 47% year-to-date, representing a 65% decline from 2021’s record high of $1,733 per thousand board feet, according to the National Association of Home Builders (NAHB). That could be good news for prospective homebuyers, who have watched lumber prices skyrocket during the pandemic, adding more than $18,600 to the average price of a new single-family home in the past year.
IN THE TWIN CITIES REGION, FOR THE WEEK ENDING JUNE 4:
- New Listings decreased 2.1% to 1,772
- Pending Sales decreased 13.7% to 1,077
- Inventory increased 7.9% to 6,968
FOR THE MONTH OF APRIL:
- Median Sales Price increased 10.0% to $370,000
- Days on Market decreased 9.7% to 28
- Percent of Original List Price Received increased 0.5% to 103.8%
- Months Supply of Homes For Sale increased 9.1% to 1.2
All comparisons are to 2021
Click here for the full Weekly Market Activity Report. From MAAR Market Data News.
Mortgage Rates Increase
June 9, 2022
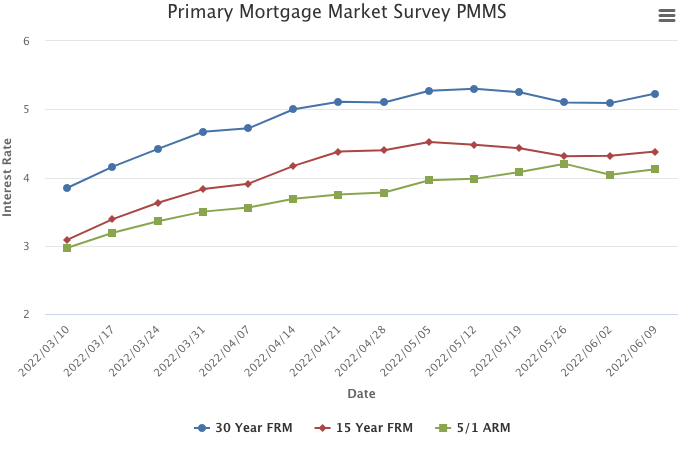
After little movement the last few weeks, mortgage rates rose again on the back of increased economic activity and incoming inflation data. The housing market is incredibly rate-sensitive, so as mortgage rates increase suddenly, demand again is pulling back. The material decline in purchase activity, combined with the rising supply of homes for sale, will cause a deceleration in price growth to more normal levels, providing some relief for buyers still interested in purchasing a home.
Information provided by Freddie Mac.
- « Previous Page
- 1
- …
- 82
- 83
- 84
- 85
- 86
- …
- 152
- Next Page »

