
- « Previous Page
- 1
- …
- 127
- 128
- 129
- 130
- 131
- …
- 151
- Next Page »
Weekly Market Report

For Week Ending June 11, 2016
The pace of new homes being built is slower than necessary to keep inventory figures up, especially in a time with plenty of demand. However, building permits are active and low mortgage rates continue to provide opportunity for the residential real estate market to continue to be a pillar of the national economic profile.
In the Twin Cities region, for the week ending June 11:
- New Listings decreased 0.3 percent to 2,056
- Pending Sales decreased 7.1% to 1,370
- Inventory decreased 19.2% to 13,869
For the month of May:
- Median Sales Price increased 5.8% to $236,900
- Days on Market decreased 21.1% to 60
- Percent of Original List Price Received increased 1.1% to 98.6%
- Months Supply of Inventory decreased 26.3% to 2.8
All comparisons are to 2015
Click here for the full Weekly Market Activity Report. From The Skinny Blog.
Sellers Uninspired by Record May Sales Activity
By Aubray Erhardt on Tuesday, June 14th, 2016
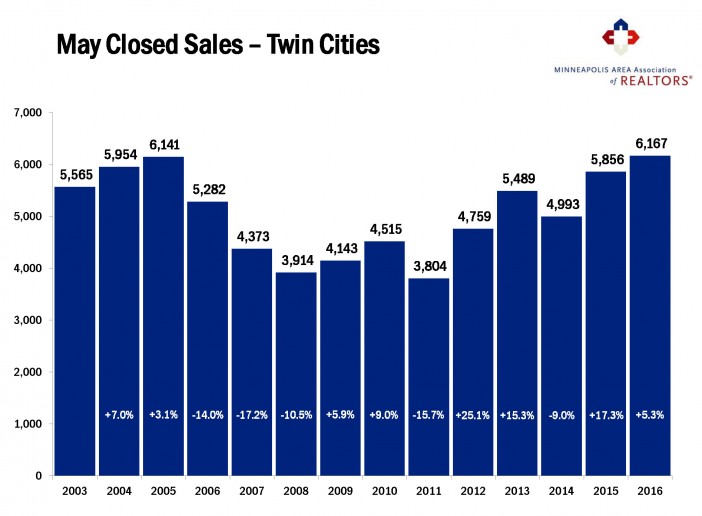
Pending home purchase activity exceeded year-ago levels for the 18th consecutive month. Buyers signed 6,809 new purchase agreements, a 9.9 percent gain compared to May 2015. Closed sales, however, rose 5.3 percent to 6,167—the highest May closed sales figure on record. In large part due to low inventory, would-be sellers are concerned about their ability to secure their next property in the current competitive environment. Inventory levels fell 20.6 percent to 13,372 active properties. Because of record demand, weak supply and a more expensive mix of homes selling, the May median sales price rose 5.7 percent to $236,826—second only to June 2006 for the highest monthly median sales price on record.
Since the median percent of current list price received at sale was 100.0 percent, sellers effectively had the same chance of getting offers above their current list price as they did below. Those odds were exactly fifty-fifty—as they were in May 2005. That’s not the case for original list price, however. Cumulative days on market fell 21.1 percent to 60 days. That’s the fastest market time for any month since the beginning of 2007. Months supply of inventory fell 28.9 percent to 2.7 months—the lowest May figure on record going back to the beginning of 2003. Generally, five to six months of supply is considered a balanced market. While the metro as a whole is favoring sellers, not all areas, segments or price points necessarily reflect that. Market conditions are encouraging some sellers but not enough to fuel the demand seen in recent months.
“By a margin of just 26 units, last month’s closed sales reached a new record for May,” said Judy Shields, Minneapolis Area Association of REALTORS® (MAAR) President. “Despite record demand, not every home sells the day it hits the market in multiple offers. Some areas are more susceptible than others. Sellers hoping for short market times should know price strategy is still one of the most important factors in marketing your home.”
Smarter lending practices, job and wage increases, population growth, the ongoing threat of higher interest rates and relentlessly rising rents have all contributed to strong sales activity. A competitive Twin Cities labor market has also contributed to our housing recovery. Traditional (non-lender-mediated) listings made up 93.3 percent of all closed sales—the highest level in almost 10 years.
The most recent national unemployment rate is 4.7 percent, though it’s 3.4 percent locally. The Minneapolis-St. Paul-Bloomington metropolitan area has the fourth lowest unemployment rate of any major metro area. The 30-year fixed mortgage rate continued to hover around 3.6 percent compared to a long-term average of approximately 8.0 percent. Rates took a surprising dive after the Federal Reserve announced the first hike last year. Marginally higher interest rates were widely expected in 2016, though futures contracts currently peg the odds of a June rate hike at 4.0 percent and a July rate hike at 36.0 percent.
“Interest rates and job growth are fueling the demand in our market,” said Cotty Lowry, MAAR President-Elect. “But we have a serious inventory shortage that we know is holding back buyers, meaning there is still pent-up demand that may not have existed in a more balanced market.”
From The Skinny Blog.
Weekly Market Report
For Week Ending June 4, 2016
Summer is heating up, as are home sales and prices. Millennials are hitting home- buying age with force and are showing interest in entering the real estate market. As inventory continues to struggle to keep up with demand, options are fewer than desired, and price wars are proving to be a challenge for many buyers in a seller’s market.
In the Twin Cities region, for the week ending June 4:
- New Listings decreased 7.9% to 2,011
- Pending Sales decreased 15.3% to 1,203
- Inventory decreased 19.5% to 13,571
For the month of May:
- Median Sales Price increased 5.7% to $236,826
- Days on Market decreased 21.1% to 60
- Percent of Original List Price Received increased 1.1% to 98.6%
- Months Supply of Inventory decreased 28.9% to 2.7
All comparisons are to 2015
Click here for the full Weekly Market Activity Report. From The Skinny Blog.
Weekly Market Report
For Week Ending May 28, 2016
The trends of higher sales and fewer homes for sale that prevailed through the first quarter of 2016 have only gotten stronger through the second quarter. Although more sellers are listing than at this time last year, it’s still not quite enough to keep up with the heat of today’s sales environment. Buyers appear to be making great offers ahead of any hint of higher mortgage rates.
In the Twin Cities region, for the week ending May 28:
- New Listings increased 2.5% to 1,734
- Pending Sales increased 18.6% to 1,597
- Inventory decreased 18.8% to 13,669
For the month of April:
- Median Sales Price increased 7.6% to $231,341
- Days on Market decreased 14.1% to 73
- Percent of Original List Price Received increased 1.0% to 98.0%
- Months Supply of Inventory decreased 25.0% to 2.7
All comparisons are to 2015
Click here for the full Weekly Market Activity Report. From The Skinny Blog.
Weekly Market Report
For Week Ending May 21, 2016
Housing has been a strong sector of the nation’s economy over the past few years, but new construction has not been growing with demand so far in 2016. Low inventory and rising prices continue to be the trends to watch. As long as the local economy stays in growth mode and aging millennials choose to buy over renting, the market should remain on an extended path of stability.
In the Twin Cities region, for the week ending May 21:
- New Listings increased 16.7% to 2,199
- Pending Sales increased 10.4% to 1,613
- Inventory decreased 19.0% to 13,533
For the month of April:
- Median Sales Price increased 7.7% to $231,450
- Days on Market decreased 14.1% to 73
- Percent of Original List Price Received increased 1.0% to 98.0%
- Months Supply of Inventory decreased 25.0% to 2.7
All comparisons are to 2015
Click here for the full Weekly Market Activity Report. From The Skinny Blog.
May Monthly Skinny Video
Weekly Market Report
For Week Ending May 14, 2016
The U.S. housing market continues to churn out positive year-over-year sales numbers, but some markers of hesitation are worth watching. Some sellers hesitate to list their homes because they are not sure that they will find an attractive replacement for their own fast-selling home. Many young consumers, saddled with student loan debt and having transient tendencies, hesitate to commit to a home purchase longer than previous generations. Nevertheless, home starts are on the rise, and the market remains strong during the busiest weeks of the year.
In the Twin Cities region, for the week ending May 14:
- New Listings decreased 3.0% to 2,120
- Pending Sales increased 9.2% to 1,607
- Inventory decreased 18.4% to 13,344
For the month of April:
- Median Sales Price increased 7.8% to $231,750
- Days on Market decreased 14.1% to 73
- Percent of Original List Price Received increased 1.0% to 98.0%
- Months Supply of Inventory decreased 25.0% to 2.7
All comparisons are to 2015
Click here for the full Weekly Market Activity Report. From The Skinny Blog.
April Sellers Bring Full Price Offers
By Aubray Erhardt on Tuesday, May 17th, 2016
New Listings showed a second year-over-year decline in 2016 while pending purchase activity rose for the 17th straight month. Buyers signed 6,373 new purchase agreements, a small but important 1.6 percent gain compared to a record-setting April 2015. Due to the well-known supply shortages in our market, would-be sellers are concerned about their ability to secure their next property in the current environment. Inventory levels fell 19.4 percent to 12,849 active properties. Because of record demand, weak supply and a more expensive mix of homes selling, the April median sales price rose 7.7 percent to $231,500. Median list price, by contrast, has already reached and exceeded its previous record, perhaps an indication that the median sales price could do the same this year.
As was the case in March, serious buyers came out swinging in April. In fact, sellers had the same chance of getting offers above their current list price as they did below. Those odds were exactly fifty-fifty—as they were in 2005. That’s not the case for original list price, which indicates that once a home is properly priced, serious buyers are willing to write full-price offers. Unsurprisingly, homes tended to sell in less time, with cumulative days on market declining 14.1 percent to 73 days. That’s the lowest April figure since 2007. Months supply of inventory fell 27.8 percent to 2.6 months—the lowest April figure on record going back to 2003. Generally, five to six months of supply is considered a balanced market. While our region as a whole is favoring sellers, not all areas, segments or price points necessarily reflect that.
“This is an important milestone that speaks to the health of our market,” said Judy Shields, Minneapolis Area Association of REALTORS® (MAAR) President. “Sellers should not interpret this to mean they are guaranteed offers above their list price. Every price range, area and segment is still unique. It’s more important now than ever to properly price your home. This means buyers–particularly those in multiple offers–should be ready to make full price offers on the properties that best fits their needs.”
The last time absorption rates, consumer demand and home prices were where they are today, the median percent of current list price received at sale was also 100.0 percent, so this isn’t entirely unfamiliar territory. There was also significantly more inventory in 2004 and 2005. The marketplace is finally closing the gap from the recession before advancing—sustained by smarter lending policy, job and wage increases, population growth, the risk of higher interest rates and relentlessly rising rents. It’s worth noting that traditional sales tend to fetch a higher ratio of sales price to list price. For the first April since 2007, traditional sales made up over 90.0 percent of overall sales, which boosts the percentage of current list price received.
The national unemployment rate for April was unchanged at 5.0 percent. With a local unemployment rate of 4.0 percent, the Minneapolis-St.Paul-Bloomington metropolitan area was among the top ten large metros with the lowest unemployment rate. The 30-year fixed mortgage rate continued to hover just above 3.6 percent compared to a long-term average of about 8.0 percent. Rates took a surprising dive after the Federal Reserve announced the first hike last year. Marginally higher rates were widely expected in 2016, even though a June rate hike seems unlikely.
“The economy is still strengthening and the market is very competitive,” said Cotty Lowry, MAAR President-Elect. “Serious buyers must be prepared to make strong offers right away or risk not having their offer accepted.”
From The Skinny Blog.
Weekly Market Report
For Week Ending May 7, 2016
Although higher than they were a year ago, mortgage applications are barely moving from week to week despite mortgage rates sitting at three-year lows. Supply remains lean across the country, and sales figures are showing some of the strain of that reality. Homes that show well continue to sell quickly and at prices that make sellers smile.
In the Twin Cities region, for the week ending May 7:
- New Listings increased 4.8% to 2,212
- Pending Sales increased 3.3% to 1,555
- Inventory decreased 19.4% to 13,011
For the month of April:
- Median Sales Price increased 7.8% to $231,750
- Days on Market decreased 14.1% to 73
- Percent of Original List Price Received increased 1.0% to 98.0%
- Months Supply of Inventory decreased 25.0% to 2.7
All comparisons are to 2015
Click here for the full Weekly Market Activity Report. From The Skinny Blog.
- « Previous Page
- 1
- …
- 127
- 128
- 129
- 130
- 131
- …
- 151
- Next Page »