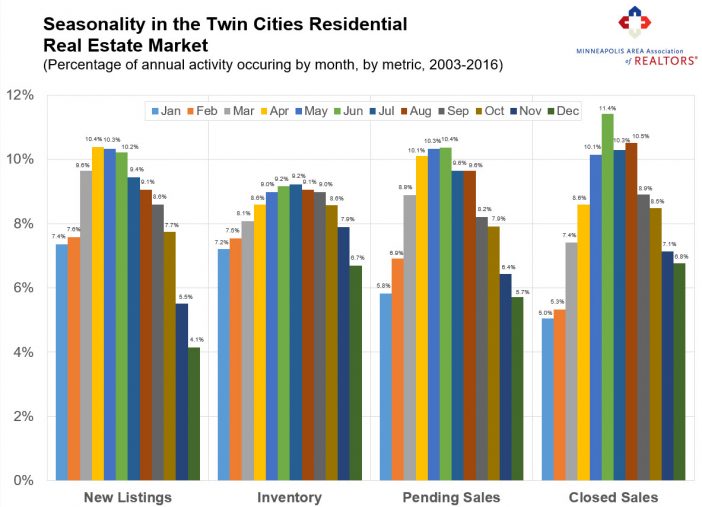
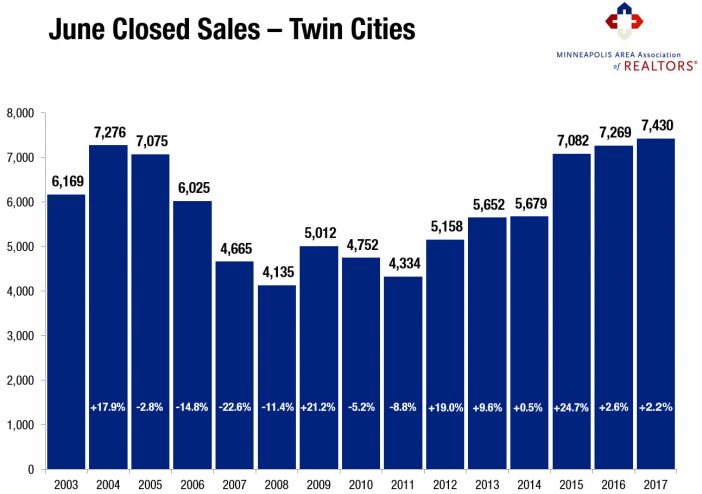
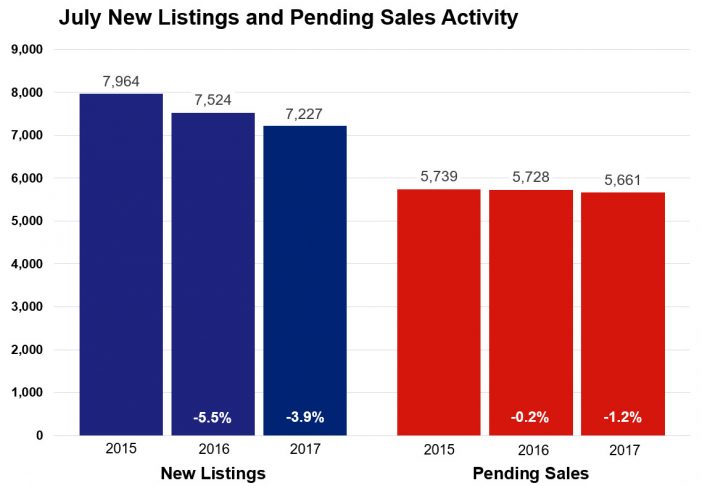
• Home
  • Search
  • My Listings
  • My Sales
  • Sellers
    • Sellers
    • Metro Markets
  • Buyers
    • Buyers
    • Calculators
    • Communities
    • Schools
  • News
  • About Me
  • « Previous Page
  • 1
  • …
  • 118
  • 119
  • 120
  • 121
  • 122
  • …
  • 135
  • Next Page »

Weekly Market Report

For Week Ending August 1, 2015

According to a recent study, housing starts are expected to be slightly over a million for the U.S. in 2015, with more than half of those being single-family homes. New home sales are expected to increase by at least 20 percent compared to last year. An increase in housing starts hints at a state of homeostasis for the residential real estate market. More homes means more choices for buyers, from first-timers to upgraders.

In the Twin Cities region, for the week ending August 1:

  • New Listings decreased 8.1% to 1,665
  • Pending Sales increased 14.3% to 1,341
  • Inventory decreased 10.1% to 17,183

For the month of July:

  • Median Sales Price increased 4.7% to $225,000
  • Days on Market decreased 7.4% to 63
  • Percent of Original List Price Received increased 0.8% to 97.6%
  • Months Supply of Inventory decreased 19.6% to 3.7

All comparisons are to 2014

Click here for the full Weekly Market Activity Report. From The Skinny Blog.

Weekly Report

Where are the lowest prices?

By David Arbit on Wednesday, August 5th, 2015

Though not quite as often as the most expensive areas, we are also occasionally asked which cities are the most affordable (least expensive). Below are tables showing the 25 lowest priced markets in the region. The top two tables rank all areas, regardless of market size. The bottom two tables only show areas with a certain volume of sales. The left table uses only June 2015 sales, while the table to the right uses 2015 YTD data (through June). The measure used is still median sales price.

Even more data to the people!

Lowest-Priced-Cities-7-2015-702x485

Lowest-Priced-Cities-7-2015-with-restrictions-702x501
From The Skinny Blog.

The Skinny

Weekly Market Report

For Week Ending July 25, 2015

According to the U.S. Census, homeownership is at 63.4 percent for the second quarter of 2015, down 1.3 percent from the second quarter of 2014. This is the lowest rate of homeownership since 1967. To put that in greater context, homeownership peaked at 69.2 percent in 2004, and the 50-year average is 65.3 percent. Although the data may be indicating otherwise on a macro level, mortgage applications have kept REALTORS® busy through summer.

In the Twin Cities region, for the week ending July 25:

  • New Listings increased 1.2% to 1,804
  • Pending Sales increased 21.3% to 1,362
  • Inventory decreased 9.8% to 17,125

For the month of June:

  • Median Sales Price increased 4.7% to $229,900
  • Days on Market decreased 5.7% to 66
  • Percent of Original List Price Received increased 0.5% to 97.7%
  • Months Supply of Inventory decreased 15.9% to 3.7

All comparisons are to 2014

Click here for the full Weekly Market Activity Report. From The Skinny Blog.

Weekly Report

Where are the Highest Prices?

By David Arbit on Wednesday, July 29th, 2015

We are often asked “Which cities have the highest home prices?” Whether it’s a member, the media or the general public inquiring, it’s a fairly common question. Wonder no more! Below are tables showing the top 25 highest priced markets in the region. The top two tables rank all areas, regardless of market size. The bottom two tables only show areas with a certain volume of sales. The left table uses just June 2015 sales, while the table to the right uses 2015 YTD data. Of course, the measure used is median sales price.

Data to the people!

Highest-Priced-Cities-7-20151-702x494
Highest-Priced-Cities-7-2015-with-restrictions1-702x501

From The Skinny Blog.

The Skinny

Weekly Market Report

For Week Ending July 18, 2015

Let’s try to never forget how bad the U.S. housing market got. The Great Recession lasted from about December 2007 to June 2009. Ever since then, and particularly in the last couple of years, the market has strengthened to once again become a cornerstone in one of the strongest economies in the world. Better lending standards, low oil prices and higher wages are a few of the catalysts for positive change. As we tip into the second half of 2015, the trends still reveal stable housing in a stable economy.

In the Twin Cities region, for the week ending July 18:

  • New Listings decreased 7.8% to 1,758
  • Pending Sales increased 7.7% to 1,210
  • Inventory decreased 9.1% to 16,973

For the month of June:

  • Median Sales Price increased 4.7% to $229,900
  • Days on Market decreased 5.7% to 66
  • Percent of Original List Price Received increased 0.5% to 97.7%
  • Months Supply of Inventory decreased 15.9% to 3.7

All comparisons are to 2014

Click here for the full Weekly Market Activity Report. From The Skinny Blog.

Weekly Report

July Monthly Skinny Video

Where has the Twin Cities real estate market been and where is it heading? This monthly summary provides an overview of current trends and projections for future activity.

Monthly Skinny Video

Conventional is King Again as Government and Investors Exit

By David Arbit on Monday, July 20th, 2015

MortgageFinanceRates_2015-063-702x492The changing popularity of various home financing tools tells a unique story and shows how the government and private sector mortgage market shares have evolved through the housing crisis and subsequent recovery.

Following the ebbs and flows of the housing market itself, the mortgage finance marketplace has also transformed over the last decade. First, some scene setting. Each trendline above represents the percentage of closed sales in the Twin Cities 13-County MSA that utilized a particular form of mortgage financing, by month. No seasonal adjustments have been performed; the data is raw and comes directly from NorthstarMLS.

Between 2005 and mid-2007, conventional loans made up about 80.0 percent of all mortgages. With conventional mortgage liquidity—shall we say—plentiful, the government only represented about 5.0 percent of loans. As the economy and housing market began to unravel in 2007, the mortgage spigot was drying up. As such, the FHA started to take up that slack and became a dominant player in the mortgage marketplace. By the time of the first-time home buyer tax credit in late-2009, FHA loans comprised a whopping 45.0 percent of sales while conventional loans made up about 35.0 percent of sales. The remaining 20.0 percent include all-cash deals and other loan products.

Though its overall effectiveness remains somewhat debatable, that tax credit signaled a turning point—at least in the mortgage market. At that moment in late-2009, conventional loan market share began to recover and FHA market share started to shrink. Fast forward to present day and conventional loans now make up 60.0 percent of the market while FHA loans make up just 20.0 percent. Earlier in 2015, FHA loans made up about 15.0 percent of closed sales, which is consistent with 2004 levels. Most recognize this as a positive, as the private sector has once again assumed the majority of the risk associated with residential mortgage lending.

All-cash sales can also be illuminating, shining light in some of the more interesting nooks and crannies. Though not all cash sales reflect investor activity, it’s one of the better indications of investors in the market and can be used as a proxy.

Between 2004 and 2008, cash deals made up about 5.0 percent of all closed sales. By February 2011, about 28.0 percent of Twin Cities homes were purchased with cash—a record high. Note the dashed orange trendline. This was at the same time as distressed (foreclosure and short sale) market share was at its highest. Traditional sales volume had fallen dramatically and investors were picking up foreclosures for $0.30 – $0.70 cents on the dollar.

Of the consumers that could, even they were understandably nervous to make large purchases such as a home. Nowadays, about 12.0 percent of sales are done in cash, the lowest share in seven years, or since the middle of 2008. That reflects a mixture of fewer foreclosures and short sales, rising prices, a rising stock market attracting more capital and low inventory levels frustrating traditional buyers and investors alike.

The market numbers are well and good, but sometimes following the money can tell a unique story. The modes of financing behind the market can signal changes in investor behavior, consumer confidence, bank lending patterns and how those forces interplay with one another.
From The Skinny Blog.

The Skinny

Weekly Market Report

For Week Ending July 11, 2015

With the economy on the ups these days, the Federal Reserve Chair, Janet Yellen, is predicting a fine-tuning of monetary policy by the end of the year. In tandem with the improving economy, the unemployment rate dropped by 0.2 percent to 5.3 percent for June 2015. It is widely believed that interest rates will go up before the year is over, which is a pretty clear indicator that the housing market is thrumming along at a good clip.

In the Twin Cities region, for the week ending July 11:

  • New Listings increased 2.7% to 2,143
  • Pending Sales increased 7.5% to 1,310
  • Inventory decreased 9.0% to 16,655

For the month of June:

  • Median Sales Price increased 4.7% to $229,900
  • Days on Market decreased 5.7% to 66
  • Percent of Original List Price Received increased 0.5% to 97.7%
  • Months Supply of Inventory decreased 15.9% to 3.7

All comparisons are to 2014

Click here for the full Weekly Market Activity Report. From The Skinny Blog.

Weekly Report

Weekly Market Report

For Week Ending July 4, 2015

As fireworks go boom, the boom of housing’s summer selling season tends to relax across the country, giving way to Facebook photos of families and friends at picnics and on road trips. Amidst the red, white and blue Instagram filters and patriotic Twitter profile pics, you’ll still likely see evidence of sales being made and articles about overall affordability. So take a quick break to play catch or chomp a hot dog, because the homeownership dream is alive and thriving this summer.

In the Twin Cities region, for the week ending July 4:

  • New Listings increased 0.2% to 1,270
  • Pending Sales increased 13.3% to 1,184
  • Inventory decreased 7.5% to 16,940

For the month of June:

  • Median Sales Price increased 4.7% to $229,900
  • Days on Market decreased 5.7% to 66
  • Percent of Original List Price Received increased 0.5% to 97.7%
  • Months Supply of Inventory decreased 15.9% to 3.7

All comparisons are to 2014

Click here for the full Weekly Market Activity Report. From The Skinny Blog.

Weekly Report

Pending and Closed Sales Both Reach Highest Level Since June 2005

By Aubray Erhardt on Monday, July 13th, 2015

The Twin Cities metropolitan housing market reached key milestones in June. Both pending purchase demand and closed unit sales officially reached 10-year highs. The last time demand was this strong was June 2005. The number of signed purchase agreements rose 19.2 percent to 6,266. Closed sales increased 22.0 percent to 6,928. Seller activity showed more modest gains compared to last year. New listings rose 4.6 percent to 8,678 during the month, which is a multi-year high. It’s the highest number of new listings for any month since April 2010. Excluding March and April of 2010, new listings were at their highest level for any month since June 2008. Despite that, the number of available properties fell 9.4 percent to 16,597 homes.

2015-06_ClosedSales-310x225

“Buyers have been extraordinarily active this spring and summer,” said Mike Hoffman, Minneapolis Area Association of REALTORS® (MAAR) President. “With both pending and closed sales activity officially reaching 10-year highs, consumers— particularly first-time buyers—understand that the timing is right. Therefore, sellers are also getting strong offers quickly.”

Given all this demand, the June 2015 median sales price climbed 4.7 percent to $229,900. That puts home prices within about 3.5 percent of the June 2006 record high of $238,000. However, the typical price per square foot, now at $128, is about 18.5 percent below its June 2006 record high.

The market landscape continues to favor sellers, even though it is still a historically attractive time to purchase real property. Because of the ongoing imbalance between supply and demand, the number of days a listing spends on the market fell 5.7 percent to 66 days. Sellers are accepting 97.8 percent of their original list price and 99.6 percent of their last list price. The Twin Cities metropolitan area currently has 3.6 months’ supply of inventory, which still signals a seller’s market. That figure dropped 18.2 percent from June 2014. This measure is essentially a ratio of supply and demand and indicates how long it would take to completely clear the market of all inventory assuming no new homes enter the marketplace.

According to the Federal Reserve, interest rates could still rise slowly later this year if the economy continues to perform well as it has been. Mortgage rates continue to hover on either side of 4.0 percent, compared with a long-term average of over 7.0 percent. The most recent data from the Bureau of Labor Statistics shows the Minneapolis-St. Paul-Bloomington metropolitan area has the third lowest unemployment rate of any major metro. That puts our region behind only sister cities Austin, TX and Salt Lake City, UT. Minnesota and the Twin Cities specifically are uniquely well positioned to compete in today’s global economy.

“With positive momentum in housing and the economy, agents across the region are helping buyers and sellers achieve their real estate goals,” said Judy Shields, MAAR President-Elect. “Since most sellers are also buyers, those sitting on the fence may not want to wait to make their move.”
From The Skinny Blog.

The Skinny

  • « Previous Page
  • 1
  • …
  • 118
  • 119
  • 120
  • 121
  • 122
  • …
  • 135
  • Next Page »

Follow Me

  • Dribbble
  • Facebook
  • LinkedIn
  • YouTube

NAR RADIO

Contact ME

All information deemed reliable but not guaranteed and should be independently verified.

Powered By WordPress | © 2025Migthy Agent LLC