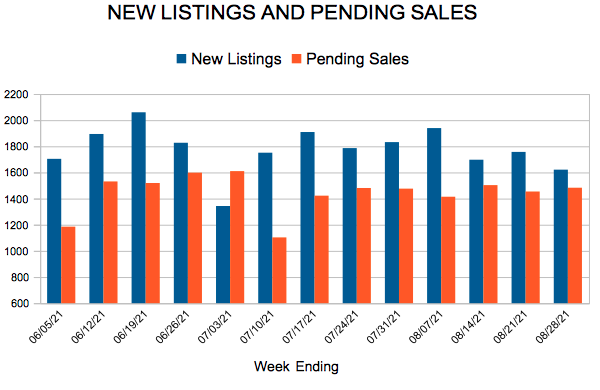
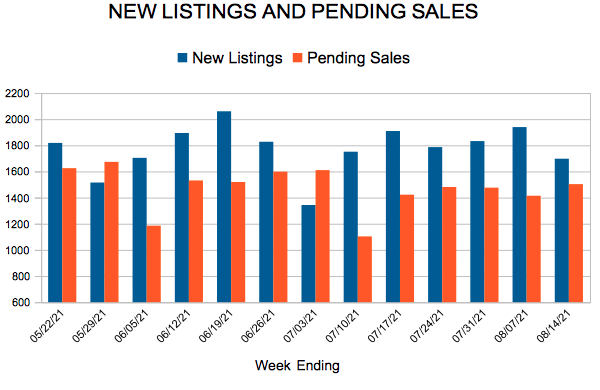
New Listings and Pending Sales

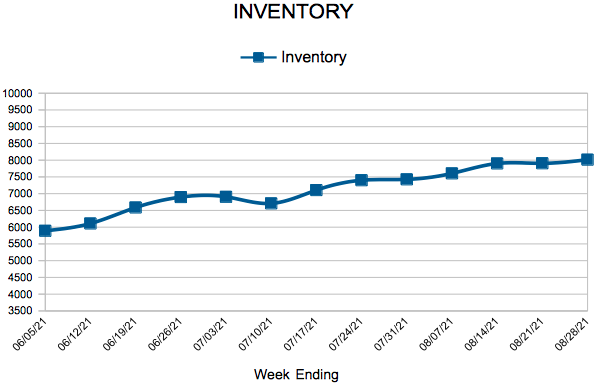
 For Week Ending August 28, 2021
Pending sales were down for a second straight month, falling 1.8% in July, according to the National Association of REALTORS®, as stiff competition for homes and high sales prices have discouraged some would-be buyers. Home prices have been soaring during the pandemic, with the S&P Corelogic Case-Shiller national home price index reporting that prices rose 18.6% nationally in June, the largest annual increase in the history of the index since 1987.
In the Twin Cities region, for the week ending August 28:
For the month of July:
All comparisons are to 2020
Click here for the full Weekly Market Activity Report. From MAAR Market Data News.
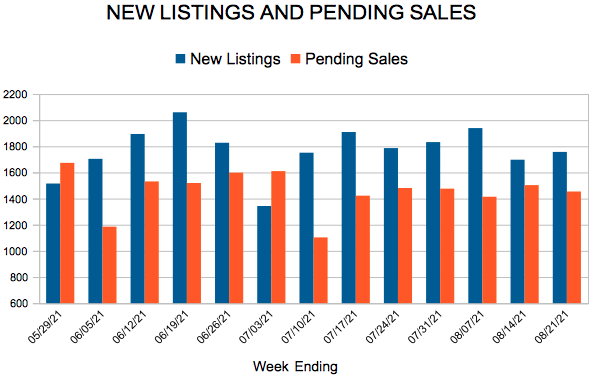
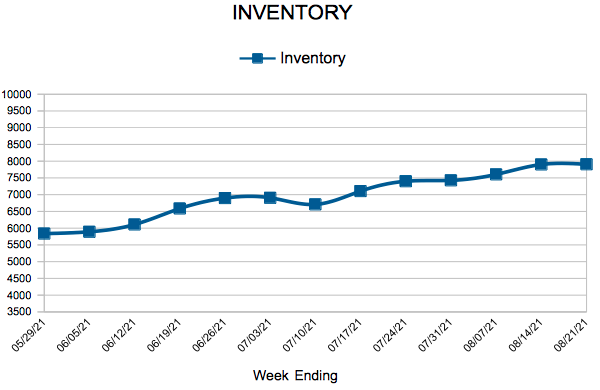 For Week Ending August 21, 2021
With the last days of summer on the horizon, experts are expecting an unusually busy fall market, as sellers continue putting more homes on the market, hoping to take advantage of record-high sales prices and strong buyer demand. The National Association of REALTORS® reports the median existing home price was up 17.8% year-over-year, and new listings were up 7.3% in July compared to June, defying seasonality trends typically seen in the fall.
In the Twin Cities region, for the week ending August 21:
For the month of July:
All comparisons are to 2020
Click here for the full Weekly Market Activity Report. From MAAR Market Data News.
 For Week Ending August 14, 2021
High home prices are the most common reason prospective buyers have yet to purchase a home, with 39% of active buyers mentioning high sales prices as the primary deterrent to not finding a home in Q2 2021, according to a recent Housing Trends report from the National Association of Home Builders. This is a change from the previous two quarters, where interested buyers reported being outbid by other offers as the most common reason for not purchasing a home.
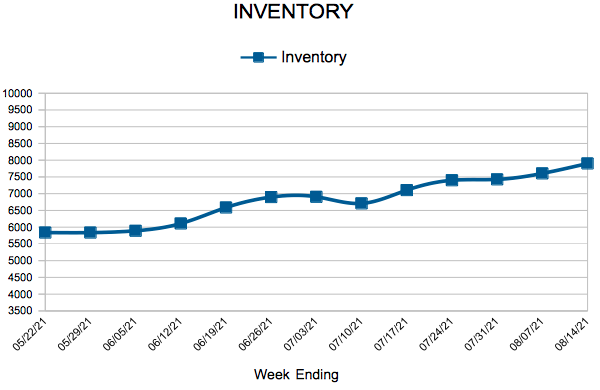
In the Twin Cities region, for the week ending August 14:
For the month of July:
All comparisons are to 2020
Click here for the full Weekly Market Activity Report. From MAAR Market Data News.