• Home
  • Search
  • My Listings
  • My Sales
  • Sellers
    • Sellers
    • Metro Markets
  • Buyers
    • Buyers
    • Calculators
    • Communities
    • Schools
  • News
  • About Me
  • « Previous Page
  • 1
  • …
  • 24
  • 25
  • 26
  • 27
  • 28
  • …
  • 34
  • Next Page »

Tight market pushes home prices to new record high in Twin Cities

Inventory hits an 18-year low with buyers competing for fewer listings

(April 16, 2021) – According to new data from the Minneapolis Area REALTORS® and the Saint Paul Area Association of REALTORS®, the median price of a home in the 16-county Twin Cities metro increased 10.3 percent from last March to a record high of $327,500. Prices were driven in part by a lack of supply.

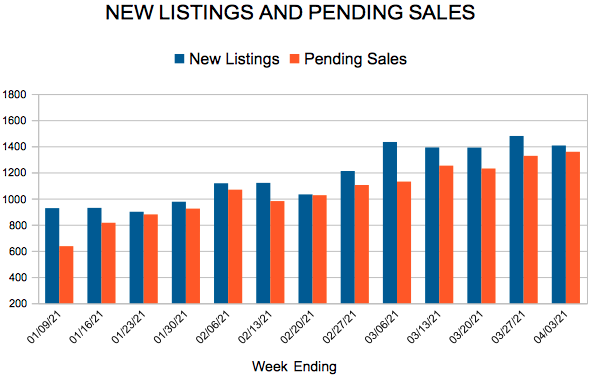
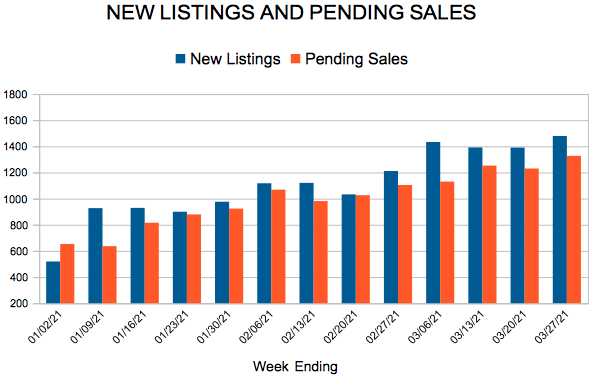
The number of homes for sale at the end of March was half of what was available a year ago. That marks an 18-year low and amounts to 0.9 months of supply. A balanced market typically has 4-6 months of supply. Market times shrank 37.7 percent to 38 days and multiple offers remain commonplace.

“Demand is still growing faster than supply,” according to Tracy Baglio, President of the Saint Paul Area Association of REALTORS®. “With less than one month of supply, buyers must be patient and understand they may lose out on a few bids before an offer is accepted. Be ready to act fast.”

Sellers listed 11.6 percent fewer homes than March 2020, offering little relief to buyers eager for more options. However, sales activity climbed above year-ago levels for the tenth straight month. Buyers continue to be motivated by attractive mortgage rates, a healing labor market and a desire for more space.

“On top of lightning-fast market times, those who choose to sell their home are often rewarded with offers at or above asking price,” said Todd Walker, President of Minneapolis Area REALTORS®. “For buyers, that means writing strong, straightforward offers right away. For sellers, it means their listings will stand out and will likely sell quickly at full price or better.”

Activity varies by area, price point and property type. Sales were up 31.9 percent in Minneapolis and 9.5 percent in St. Paul, suggesting demand remains strong in the core cities. Condos sales rose 31.7 percent, outpacing single-family and townhomes. New construction sales rose 25.5 percent while previously owned homes rose 0.7 percent. Sales of luxury properties ($1M+) have been soaring—up 70.9 percent from last March.

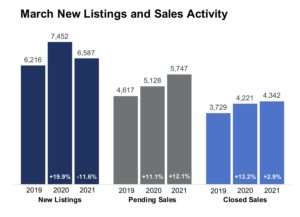
March 2021 by the numbers compared to a year ago

  • Sellers listed 6,587 properties on the market, an 11.6 percent decrease from last March
  • Buyers signed 5,747 purchase agreements, up 12.1 percent (4,342 closed sales, up 2.9 percent)
  • Inventory levels fell 50.7 percent to 4,907 units
  • Months Supply of Inventory was down 52.6 percent to 0.9 months (4-6 months is balanced)
  • The Median Sales Price rose 10.3 percent to $327,500
  • Days on Market decreased 37.7 percent to 38 days, on average (median of 11, down 57.7 percent)
  • Changes in Sales activity varied by market segment
    • Single family sales were down 1.1 percent; condo sales rose 31.7 percent; townhome sales increased 8.7 percent
    • Traditional sales rose 4.5 percent; foreclosure sales were down 42.9 percent; short sales fell 63.2 percent
    • Previously owned sales were up 0.7 percent; new construction sales climbed 25.2 percent

From The Skinny Blog.

The Skinny

New Listings and Pending Sales

The Skinny

New Listings and Pending Sales

The Skinny

Long-awaited inventory gains finally arrive

By David Arbit on Tuesday, December 18th, 2018

For the first time since April 2015, there were more homes listed for sale in the Twin Cities metro than the same month the year prior. After years of strong buyer activity and weak seller activity, the tides seem to finally be shifting. Seller activity has been accelerating since the middle of this year. Meanwhile, the last four months all showed year-over-year decreases in pending sales. Unit sales volumes are still healthy, though there is some downward pressure brought on by tight inventory and rising prices and rates. The market is decelerating, but not yet contracting. Prices continue to rise, and homes are selling in less time. But absorption rates and the ratio of sold to list price are starting to ease. That’s good news for buyers, even though sellers still have strong negotiating power.

The number of active listings for sale has increased compared to the prior year. Buyers haven’t seen inventory gains in over 3.5 years. Months supply also ticked up to 2.1 months, suggesting the market is still tight but it is rebalancing and normalizing. After increasing in October and November, rates have settled back down around September levels. The lack of supply is especially noticeable at the entry-level prices, where multiple offers and homes selling for over list price are commonplace. The move-up and upper-bracket segments are less competitive and—for the most part—much better supplied. Inventory could double while sales remain stable and we’d still have less than 5 months of supply.

November 2018 by the Numbers (compared to a year ago)

Sellers listed 3,992 properties on the market, a 12.6 percent increase from last November

Buyers closed on 4,629 homes, a 0.9 percent decrease

Inventory levels for November rose 2.3 percent compared to 2017 to 10,181 units

Months Supply of Inventory was increased 10.5 percent to 2.1 months

The Median Sales Price rose 8.2 percent to $265,150, a record high for November

Cumulative Days on Market declined 7.1 percent to 52 days, on average (median of 31)

Changes in Sales activity varied by market segment:

Single family sales fell 1.1 percent; condo sales jumped 18.7 percent; townhome sales declined 3.3 percent

Traditional sales rose 1.3 percent; foreclosure sales sank 44.1 percent; short sales fell 42.9 percent

Previously-owned sales were down 3.2 percent; new construction sales ramped up by 28.7 percent
From The Skinny Blog.

The Skinny

Supply tight but flattening, prices still rising, sales fluctuating

By David Arbit on Friday, November 16th, 2018

As sentiments regarding the direction of housing markets have changed, it’s worth remembering two key facts. First, all housing is local—what’s happening in San Francisco, Seattle and Denver is not reflective of the Minneapolis-St. Paul market. Second, the housing market faces fewer risks than in the mid-2000s. After years of strong buyer activity and weak seller activity, the tides seem to finally be shifting. Five of the last six months showed increases in new listings; while five of the last six months also had decreases in pending sales. It’s worth noting there’s a significant difference between deceleration and contraction. The market is decelerating, but not yet contracting. Prices continue to rise, homes are selling in less time and sellers are yielding a higher share of their list price.

Excluding September 2018, October had the smallest decline in active listings since May 2015, and those long-awaited inventory gains could arrive as early as next year. Months supply was stable at 2.4 months, suggesting a tight market but also a flattening out pattern. Rising rates could impact some budget-conscious buyers. The lack of supply is especially noticeable at the entry-level prices, where multiple offers and homes selling for over list price are commonplace. The move-up and upper-bracket segments are less competitive and—for the most part—much better supplied. Inventory could double while sales remain stable and we’d still have less than 5 months of supply.

OCTOBER 2018 BY THE NUMBERS (COMPARED TO A YEAR AGO)

– Sellers listed 6,011 properties on the market, a 9.2 percent increase
– Buyers closed on 5,235 homes, a 3.4 percent increase from last October
– Inventory levels for October fell 2.2 percent compared to 2017 to 11,719 units
– Months Supply of Inventory was flat at 2.4 months
– The Median Sales Price rose 8.6 percent to $265,000, a record high for September
– Cumulative Days on Market declined 7.7 percent to 48 days, on average (median of 28)
– Changes in Sales activity varied by market segment:

Single family sales rose 4.4 percent; condo sales jumped 10.6 percent; townhome sales were flat
Traditional sales rose 5.2 percent; foreclosure sales sank 41.2 percent; short sales rose 4.5 percent
Previously-owned sales were up 3.7 percent; new construction sales increased 12.3 percent
From The Skinny Blog.

The Skinny

More Early Signs of Shifting Market Tides

By David Arbit on Wednesday, October 17th, 2018

After years of strong buyer activity and weak seller activity, the market tides seem to finally be shifting back toward balance. Strong demand and weak supply have created an environment that favors sellers. But if anything can be called a constant in the market—it’s change. Four of the last five months showed increases in new listings; while four of the last five months also had decreases in pending sales.

While the market hasn’t quite transformed, the dynamics are shifting and the market is transitioning. September saw the smallest decline in active listings since May 2015, and those long-awaited inventory gains could still happen this year. Months supply was down just 3.8 percent to 2.5 months. Today’s buyers still face plenty of competition over limited supply. However, a recent uptick in rates could further impact some budget-conscious buyers. Locking in at current levels would be advantageous in a rising rate environment.Sellers yielded an average of 98.4 percent of their original list price and 99.7 percent of their current list price, partly illustrating that the shortage still looms. The lack of supply is especially noticeable at the entry-level prices, where multiple offers and homes selling for over list price have become commonplace. The move-up and upper-bracket segments are less competitive and—for the most part—much better supplied. It’s noteworthy that inventory levels could double while sales remain stable and we’d still have less than 5 months of supply.

September 2018 by the Numbers (compared to a year ago)• Sellers listed 6,857 properties on the market, a 5.9 percent increase
• Buyers closed on 5,087 homes, a 5.8 percent decrease from last September
• Inventory levels for September fell 4.4 percent compared to 2017 to 12,570 units
• Months Supply of Inventory was down 3.8 percent to 2.5 months
• The Median Sales Price rose 6.1 percent to $262,000, a record high for September
• Cumulative Days on Market declined 16.0 percent to 42 days, on average (median of 24)
• Changes in Sales activity varied by market segment

• Single family sales fell 6.3 percent; condo sales declined 1.1 percent; townhome sales rose 0.4 percent
• Traditional sales fell 4.0 percent; foreclosure sales sank 41.1 percent; short sales dropped 25.0 percent
• Previously-owned sales were down 5.9 percent; new construction sales increased 11.5 percent

From The Skinny Blog.

The Skinny

Gung-Ho Sellers Post Largest Increase in Nearly Three Years

By David Arbit on Wednesday, September 19th, 2018

More sellers are feeling optimistic about listing their homes just as humidity, cabin weekends and food-on-a-stick give way to rakes, school buses and sweater vests. Compared to last August, Twin Cities sellers listed 7.6 percent more homes on the market. That was the largest increase since late-2015. Although buyers signed 2.9 percent fewer contracts than last year, they did manage to close on slightly more deals. Three of the last four months had increases in new listings; three of the last four months had decreases in pending sales. This trend of rising seller activity and moderating buyer activity suggests we could be approaching those long-awaited inventory gains. Sure enough, the 7.8 percent decline was the smallest decrease in inventory in over three years. Months supply was down just 3.8 percent to 2.5 months.

That said, today’s buyers still face plenty of competition over limited supply. Sellers yielded an average of 99.2 percent of their original list price and 100.1 percent of their current list price, illustrating how drastically undersupplied markets tend to favor sellers. The shortage is especially noticeable at the entry-level prices, where multiple offers and homes selling for over list price have become commonplace. The move-up and upper-bracket segments are less competitive and—for the most part—much better supplied. The market remains relatively tight, but there are some early signs that things could be loosening up for buyers.

August 2018 by the Numbers (compared to a year ago)
• Sellers listed 7,814 properties on the market, a 7.6 percent increase
• Buyers closed on 6,629 homes, a 0.2 percent increase from last August
• Inventory levels for August fell 7.8 percent compared to 2017 to 12,243 units
• Months Supply of Inventory was down 3.8 percent to 2.5 months
• The Median Sales Price rose 6.3 percent to $268,000, a record high for August
• Cumulative Days on Market declined 16.7 percent to 40 days, on average (median of 21)
• Changes in Sales activity varied by market segment

o Single family sales fell 0.8 percent; condo sales rose 15.3 percent; townhome sales increased 1.1 percent
o Traditional sales rose 1.5 percent; foreclosure sales sank 35.4 percent; short sales dropped 31.3 percent
o Previously-owned sales were down 0.5 percent; new construction sales increased 20.9 percent

From The Skinny Blog.

The Skinny

Sales Flatten while Sellers Capitalize on Price Gains

By David Arbit on Thursday, August 16th, 2018

New listings increased this July compared to last year, which could hint at a flurry of sellers looking to take advantage of this strong market. July marked the second increase in seller activity since November 2017. Meanwhile, buyer activity flattened out after seven months of year-over-year declines. This trend of rising seller activity and moderating buyer activity could mean more inventory coming down the pipeline. Increasing seller activity combined with a cool-down in demand is consistent with a loosening marketplace. That said, buyers shopping this summer and fall will still face stiff competition. Cooling buyer activity is likely a reflection of the shortage of homes for sale. Sellers yielded an average of 99.8 percent of their original list price and 100.6 percent of their current list price, illustrating how undersupplied markets tend to favor those with something to sell. The shortage is especially noticeable at the entry-level prices, where multiple offers and homes selling for over list price have become increasingly common. The move-up and upper-bracket segments are less competitive and better supplied. The market remains relatively tight, but there are some early signs that things could be loosening up to provide relief to buyers.

July 2018 by the Numbers (compared to a year ago)

Sellers listed 7,671 properties on the market, a 4.1 percent increase
Buyers closed on 6,242 homes, almost dead-even with last July
Inventory levels for July fell 13.5 percent compared to 2017 to 11,709 units
Months Supply of Inventory was down 11.1 percent to 2.4 months
The Median Sales Price rose 6.6 percent to $268,000, a record high for July
Cumulative Days on Market declined 17.4 percent to 38 days, on average (median of 18)
Changes in Sales activity varied by market segment

Single family sales fell 1.8 percent; condo sales rose 13.4 percent; townhome sales increased 5.2 percent
Traditional sales rose 1.2 percent; foreclosure sales sank 39.3 percent; short sales dropped 23.3 percent
Previously-owned sales were even with last year; new construction sales increased 14.0 percent

From The Skinny Blog.

The Skinny

Sellers: flat. Buyers: down. Prices: up.

By David Arbit on Wednesday, July 18th, 2018

Seller activity was relatively flat in June while buyers pulled back somewhat. For the first time since 2010, new listings surpassed 9,000 in May of this year. That’s encouraging, even though June seller activity was down slightly compared to last year. Increasing or steady seller activity combined with a cool down in demand is consistent with a loosening marketplace. That said, buyers shopping this spring and summer will still face stiff competition. While sellers are receiving full-price-or-better offers in record time, listings still need to show well and be priced properly. June marked the seventh consecutive month of year-over-year declines in closed sales, likely reflecting the shortage of homes for sale.

Strong demand and low supply means sellers yielded an average of 100.3 percent of their list price in June, a record high for any month since at least the beginning of 2003. The shortage is especially noticeable at the entry-level prices, where multiple offers and homes selling for over list price have become increasingly common.

The move-up and upper-bracket segments are less competitive and better supplied. Yes, the housing market is tight out there—sometimes frustratingly so. But over 54,000 Twin Cities buyers and sellers have managed to successfully transact real property so far this year.

June 2018 by the Numbers (compared to a year ago)

Sellers listed 8,730 properties on the market, a 1.2 percent decrease
Buyers closed on 7,063 homes, a 8.1 percent decrease
Inventory levels for June fell 15.9 percent compared to 2017 to 11,374 units
Months Supply of Inventory was down 14.8 percent to 2.3 months
The Median Sales Price rose 5.7 percent to $271,900, a record high
Cumulative Days on Market declined 14.6 percent to 41 days, on average (median of 16)
Changes in Sales activity varied by market segment

Single family sales sank 7.1 percent; condo sales rose 8.4 percent; townhome sales declined 13.7 percent
Traditional sales fell 6.6 percent; foreclosure sales sank 39.3 percent; short sales dropped 39.0 percent
Previously-owned sales fell 7.4 percent; new construction sales decreased 4.3 percent

From The Skinny Blog.

The Skinny

  • « Previous Page
  • 1
  • …
  • 24
  • 25
  • 26
  • 27
  • 28
  • …
  • 34
  • Next Page »

Follow Me

  • Dribbble
  • Facebook
  • LinkedIn
  • YouTube

NAR RADIO

Contact ME

All information deemed reliable but not guaranteed and should be independently verified.

Powered By WordPress | © 2025Migthy Agent LLC