
- « Previous Page
- 1
- …
- 122
- 123
- 124
- 125
- 126
- …
- 148
- Next Page »
Weekly Market Report

For Week Ending August 6, 2016
Housing markets across the nation have mostly reached full recovery and are even approaching or achieving categorical highs in sales and prices, yet builders are still focusing on higher-end homes over starter homes in order to combat high land and building permit costs. Until there is more entry-level inventory on the market, sustainable balance will be difficult.
In the Twin Cities region, for the week ending August 6:
- New Listings increased 2.3% to 1,795
- Pending Sales decreased 1.9% to 1,258
- Inventory decreased 17.7% to 14,495
For the month of July:
- Median Sales Price increased 6.6% to $239,900
- Days on Market decreased 14.3% to 54
- Percent of Original List Price Received increased 0.8% to 98.4%
- Months Supply of Inventory decreased 21.1% to 3.0
All comparisons are to 2015
Click here for the full Weekly Market Activity Report. From The Skinny Blog.
Twin Cities Homes Selling in Record Time, But Key Differences Persist
By Aubray Erhardt on Friday, August 12th, 2016
Seller activity declined 5.5 percent since last July, as sellers introduced 7,522 new listings to the marketplace. Sales activity was slightly below year-ago levels. Closed sales fell 5.8 percent while pending sales—the number of signed purchase agreements—fell 3.1 percent. Buyers signed 5,560 new contracts and closed on 6,030 homes. That closed sales figure is on par with July 2003 levels. The July median sales price retreated slightly since June 2016, but increased 6.6 percent from July 2015 to $239,900. Mostly due to inventory constraints, prospective sellers are concerned about their ability to secure their next property in the current environment. Buyers saw little supply side relief, as inventory levels fell 18.1 percent to 14,457 active properties. The well-known inventory shortages haven’t slowed down buyers much, given June 2016 closed sales at a 12-year high.
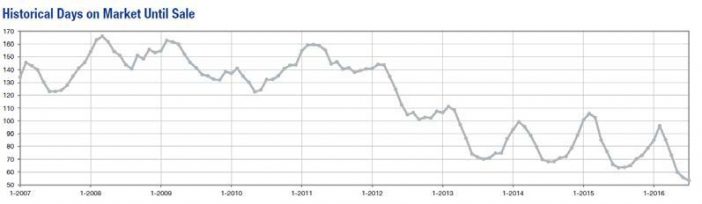
Low inventory, however, has helped draw out stronger offers. The average percent of original list price received at sale was 98.4 percent, the highest figure for any July since 2005. Low levels of for-sale housing also means the homes on the market tend to sell quickly. Cumulative days on market until sale fell 15.9 percent to 53 days. That’s the fastest market time for any month since the beginning of 2007. Months supply of inventory fell 23.7 percent to 2.9 months—the lowest July figure on record going back to the beginning of 2003. Generally, five to six months of supply is considered a balanced market.
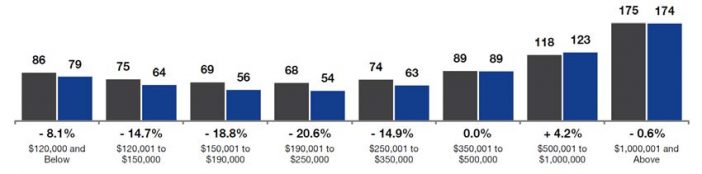
Our days on market indicator tells us that most homes are selling pretty quickly,” said Judy Shields, Minneapolis Area Association of REALTORS® (MAAR) President. “But that market-wide figure leaves out important differences between various communities, property types and price points. For example, the July market-wide average was 53 days but homes priced above $1 million are spending 174 days on the market.”
Over the last 12 months, properties in the $190,000 to $250,000 range have tended to sell the quickest, at an average of 54 days. As the price point rises, so does the amount of time spent on the market. There is a sweet spot whereby both lower and higher priced homes take longer to sell.
It’s also worth noting that the average market time figure can be skewed by properties that linger on the market. The median days on market was actually 25 for July, reflecting the mid-point where half the homes spent longer than 25 days on the market and half spent less.
“Those selling properties above the $500,000 mark know that patience is a virtue even in our current environment,” said Cotty Lowry, MAAR President-Elect. “The supply-demand balance in that segment is less competitive than the entry-level price points, plus consumers are limiting how much house they buy.”
Weekly Market Report
For Week Ending July 30, 2016
It’s only August, but this time during summer usually means making plans for changes ahead, especially the start of a new school year. For potential home buyers with school-aged children, these are the pivotal days for deciding whether or not to purchase or wait. With inventory as low as it is, we are in a place where big moves will be made or saved for later, and sales figures will reflect as much.
In the Twin Cities region, for the week ending July 30:
- New Listings increased 3.3% to 1,723
- Pending Sales decreased 4.6% to 1,289
- Inventory decreased 18.0% to 14,588
For the month of July:
- Median Sales Price increased 6.6% to $239,900
- Days on Market decreased 15.9% to 53
- Percent of Original List Price Received increased 0.8% to 98.4%
- Months Supply of Inventory decreased 23.7% to 2.9
All comparisons are to 2015
Click here for the full Weekly Market Activity Report. From The Skinny Blog.
Weekly Market Report
For Week Ending July 23, 2016
Homes are selling faster now than they have in the past six to seven years, resulting in the need for buyers to move quickly on a home purchase. Although high prices usually encourage more sellers to come forth, people have proven hesitant to put their homes on the market due to concerns about being able to find their own new and reasonably priced home.
In the Twin Cities region, for the week ending July 23:
- New Listings increased 1.3% to 1,826
- Pending Sales decreased 4.6% to 1,298
- Inventory decreased 18.0% to 14,546
For the month of June:
- Median Sales Price increased 5.3% to $242,000
- Days on Market decreased 16.7% to 55
- Percent of Original List Price Received increased 1.0% to 98.7%
- Months Supply of Inventory decreased 23.7% to 2.9
All comparisons are to 2015
Click here for the full Weekly Market Activity Report. From The Skinny Blog.
July Monthly Skinny Video
Weekly Market Report
For Week Ending July 16, 2016
Tight credit seemed to be a factor in keeping new home construction down during the first half of 2016, but the situation is improving. June housing starts were up 4.8% from the month prior, as building recovers slowly from the housing bust. This is news we’re happy to report, especially when taking the continuing concern of high demand and low inventory into consideration.
In the Twin Cities region, for the week ending July 16:
- New Listings increased 8.0% to 1,896
- Pending Sales increased 10.6% to 1,332
- Inventory decreased 18.4% to 14,376
For the month of June:
- Median Sales Price increased 5.3% to $242,000
- Days on Market decreased 15.2% to 56
- Percent of Original List Price Received increased 0.9% to 98.6%
- Months Supply of Inventory decreased 23.7% to 2.9
All comparisons are to 2015
Click here for the full Weekly Market Activity Report. From The Skinny Blog.
Ten Years Later To The Month: Twin Cities Home Prices Eclipse 2006 Record
By Aubray Erhardt on Tuesday, July 19th, 2016
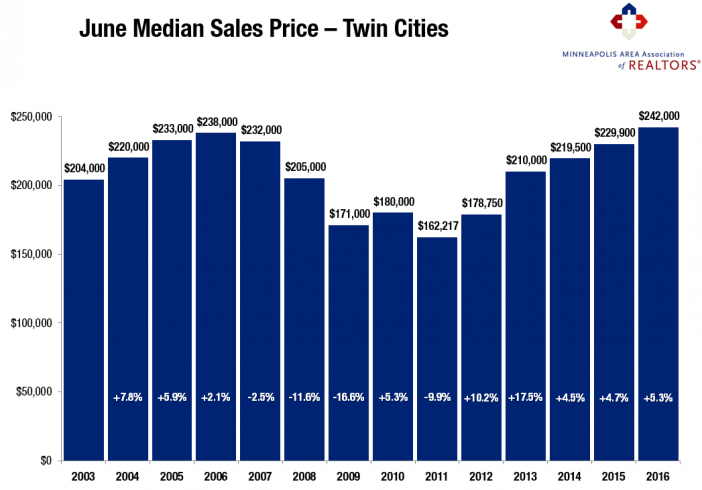
The June 2016 median sales price for residential properties has reached a new all-time high, eclipsing the previous June 2006 record of $238,000. This measure of home prices rose 5.3 percent from June 2015 to $242,000. Seller activity rose 0.5 percent since last June to 8,727 new listings. Sales activity was roughly even with last year. Closed sales increased a modest 0.2 percent while pending sales—the number of signed purchase agreements—fell 0.7 percent. Buyers signed 6,175 new contracts and closed on 7,094 homes. That’s the highest volume of closed sales for any month going back to June 2004, a 12-year high. Mostly due to inventory constraints, prospective sellers are concerned about their ability to secure their next property in the current environment. June offered little supply-side relief, as inventory levels fell 18.2 percent to 14,214 active properties. Despite the attempt, consistent inventory shortages haven’t slowed down buyers much, given closed sales at a 12-year high.
Low inventory has helped draw out stronger offers. The average percent of original list price received at sale was 98.7 percent in June, the highest figure for any month since May 2005. Low levels of for-sale housing also means the homes on the market tend to sell quickly. Cumulative days on market until sale fell 16.7 percent to 55 days. That’s the fastest market time for any month since the beginning of 2007. Months supply of inventory fell 23.7 percent to 2.9 months—the lowest June figure on record going back to the beginning of 2003. Generally, five to six months of supply is considered a balanced market. While the metro as a whole is favoring sellers, not all areas, segments or price points necessarily reflect that. Market conditions are encouraging some sellers but not enough to fuel the demand seen in recent months.
 “Prices returning to 2006 levels is nothing to fear,” said Judy Shields, Minneapolis Area Association of REALTORS® (MAAR) President. “This market is grounded in good fundamentals: supply and demand, smarter lending standards, job and wage growth, population growth, healthier household finances and rising rents. In the lead-up to 2006, home prices were driven by irrational exuberance and lax lending standards.”
A healthy Twin Cities labor market has also been conducive to our housing recovery. The most recent national unemployment rate is 4.9 percent, though it’s 3.1 percent locally. The Minneapolis-St. Paul-Bloomington metropolitan area has the third lowest unemployment rate of any major metro area. The fact that lower-priced foreclosures and short sales comprise a shrinking share of sales activity also helps with the recovery. Traditional (non-lender-mediated) properties made up 95.0 percent of all closed sales—the highest level in almost 10 years.
For the time being, the risk of higher interest rates seems to have subsided after “Brexit” and in light of other global economic concerns. Locally, the 30-year fixed mortgage rate fell to 3.5 percent compared to a long-term average of about 8.0 percent. Rates are now at their lowest level in three years. Marginally higher rates were widely expected in 2016, but further rate hikes are unlikely for the duration of the year.
“It shouldn’t be all that surprising that we’re back to where we were ten years ago,” said Cotty Lowry, MAAR President-Elect. “The forces behind this recovery are far more sustainable than last time. Clearly the Twin Cities economy is booming, even though buyers are still eager for more listings.”
From The Skinny Blog.
Weekly Market Report
For Week Ending July 9, 2016
Sales have been brisk this summer, as the largest living generation in the U.S., the Millennials, enters the housing market in droves. Student loan debt is still a hindrance for many, but that has often been offset by continued low rates allowing for lower monthly mortgage payments. With rents on the rise, conditions for further sales are good, although, traditionally, the second half of summer is not as active as the first half.
In the Twin Cities region, for the week ending July 9:
- New Listings decreased 23.2% to 1,649
- Pending Sales decreased 20.4% to 1,033
- Inventory decreased 18.5% to 14,104
For the month of June:
- Median Sales Price increased 5.3% to $242,000
- Days on Market decreased 16.7% to 55
- Percent of Original List Price Received increased 1.0% to 98.7%
- Months Supply of Inventory decreased 23.7% to 2.9
All comparisons are to 2015
Click here for the full Weekly Market Activity Report. From The Skinny Blog.
Weekly Market Report
For Week Ending July 2, 2016
The United Kingdom vote for exit from the European Union (Brexit) has likely already had at least one short-term effect on the U.S. housing market. The decision to not raise interest rates until later this year was likely made because of Brexit, so unrest in financial markets can be watched further with hopes of stabilization. Long-term effects may include more or less foreign investment in U.S. residential real estate, but wholesale price declines are not expected any time soon.
In the Twin Cities region, for the week ending July 2:
- New Listings increased 24.2% to 1,589
- Pending Sales increased 12.9% to 1,351
- Inventory decreased 17.7% to 14,480
For the month of June:
- Median Sales Price increased 5.3% to $242,000
- Days on Market decreased 16.7% to 55
- Percent of Original List Price Received increased 1.0% to 98.7%
- Months Supply of Inventory decreased 23.7% to 2.9
All comparisons are to 2015
Click here for the full Weekly Market Activity Report. From The Skinny Blog.
- « Previous Page
- 1
- …
- 122
- 123
- 124
- 125
- 126
- …
- 148
- Next Page »