For Week Ending April 1, 2017
Confidence in buying a home has fallen according to the Fannie Mae Home Purchase Sentiment Index after hitting an all-time index high in February. Continuing price increases and low inventory are easy answers for why the index fell. The good news is that an improved employment outlook and higher wages are major factors toward purchasing a home, and demand is not expected to abate.
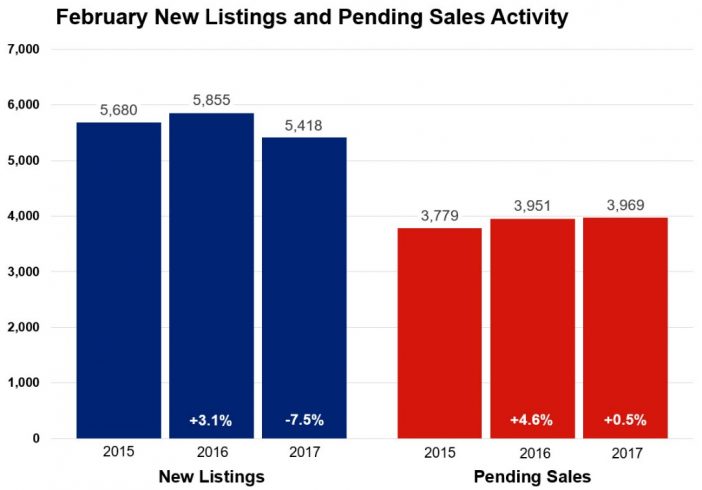
In the Twin Cities region, for the week ending April 1:
- New Listings decreased 3.9% to 1,874
- Pending Sales decreased 5.2% to 1,303
- Inventory decreased 21.7% to 10,003
For the month of February:
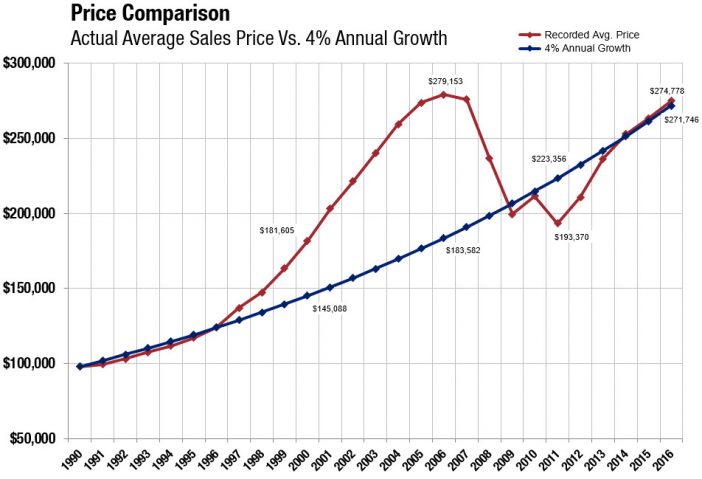
- Median Sales Price increased 7.7% to $223,250
- Days on Market decreased 14.6% to 82
- Percent of Original List Price Received increased 1.4% to 96.5%
- Months Supply of Inventory decreased 28.0% to 1.8
All comparisons are to 2016
Click here for the full Weekly Market Activity Report. From The Skinny Blog.