For Week Ending May 5, 2018
Year-over-year percentage changes for housing metrics like inventory, median sales price and days on market have sometimes looked dramatic over the past few years in most markets across the country not named Houston. But as faster sales and higher prices persist, another trend is beginning to emerge: reliability. Although more market balance is preferred, the current situation has proven to be surprisingly sustainable, at least for the time being.
In the Twin Cities region, for the week ending May 5:
- New Listings decreased 13.9% to 2,054
- Pending Sales decreased 10.0% to 1,456
- Inventory decreased 23.2% to 9,155
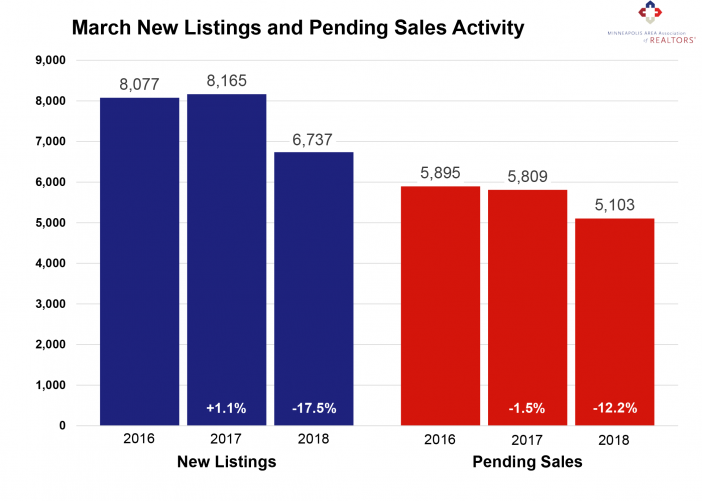
For the month of March:
- Median Sales Price increased 9.8% to $258,050
- Days on Market decreased 21.9% to 57
- Percent of Original List Price Received increased 1.1% to 99.1%
- Months Supply of Inventory decreased 22.7% to 1.7
All comparisons are to 2017
Click here for the full Weekly Market Activity Report. From The Skinny Blog.