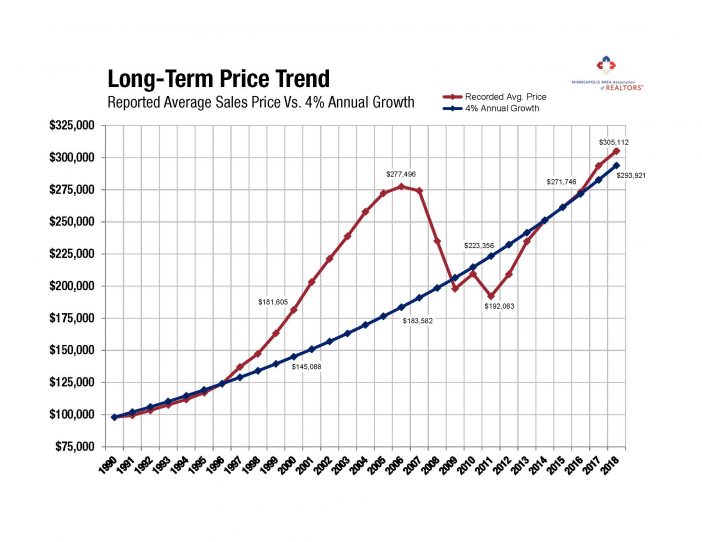
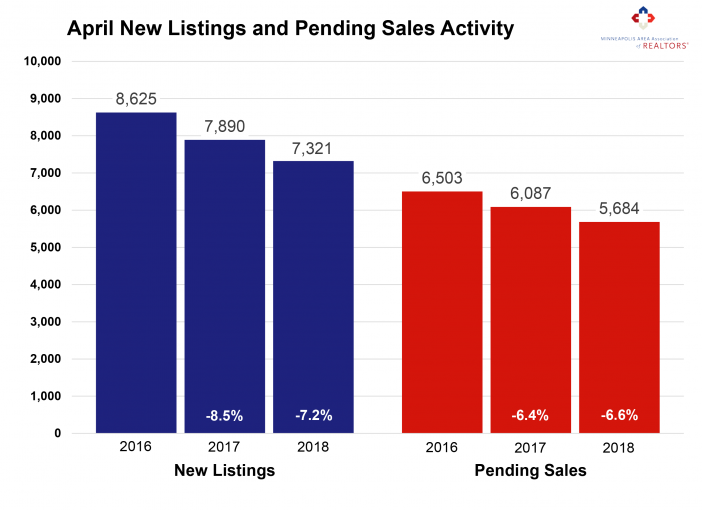
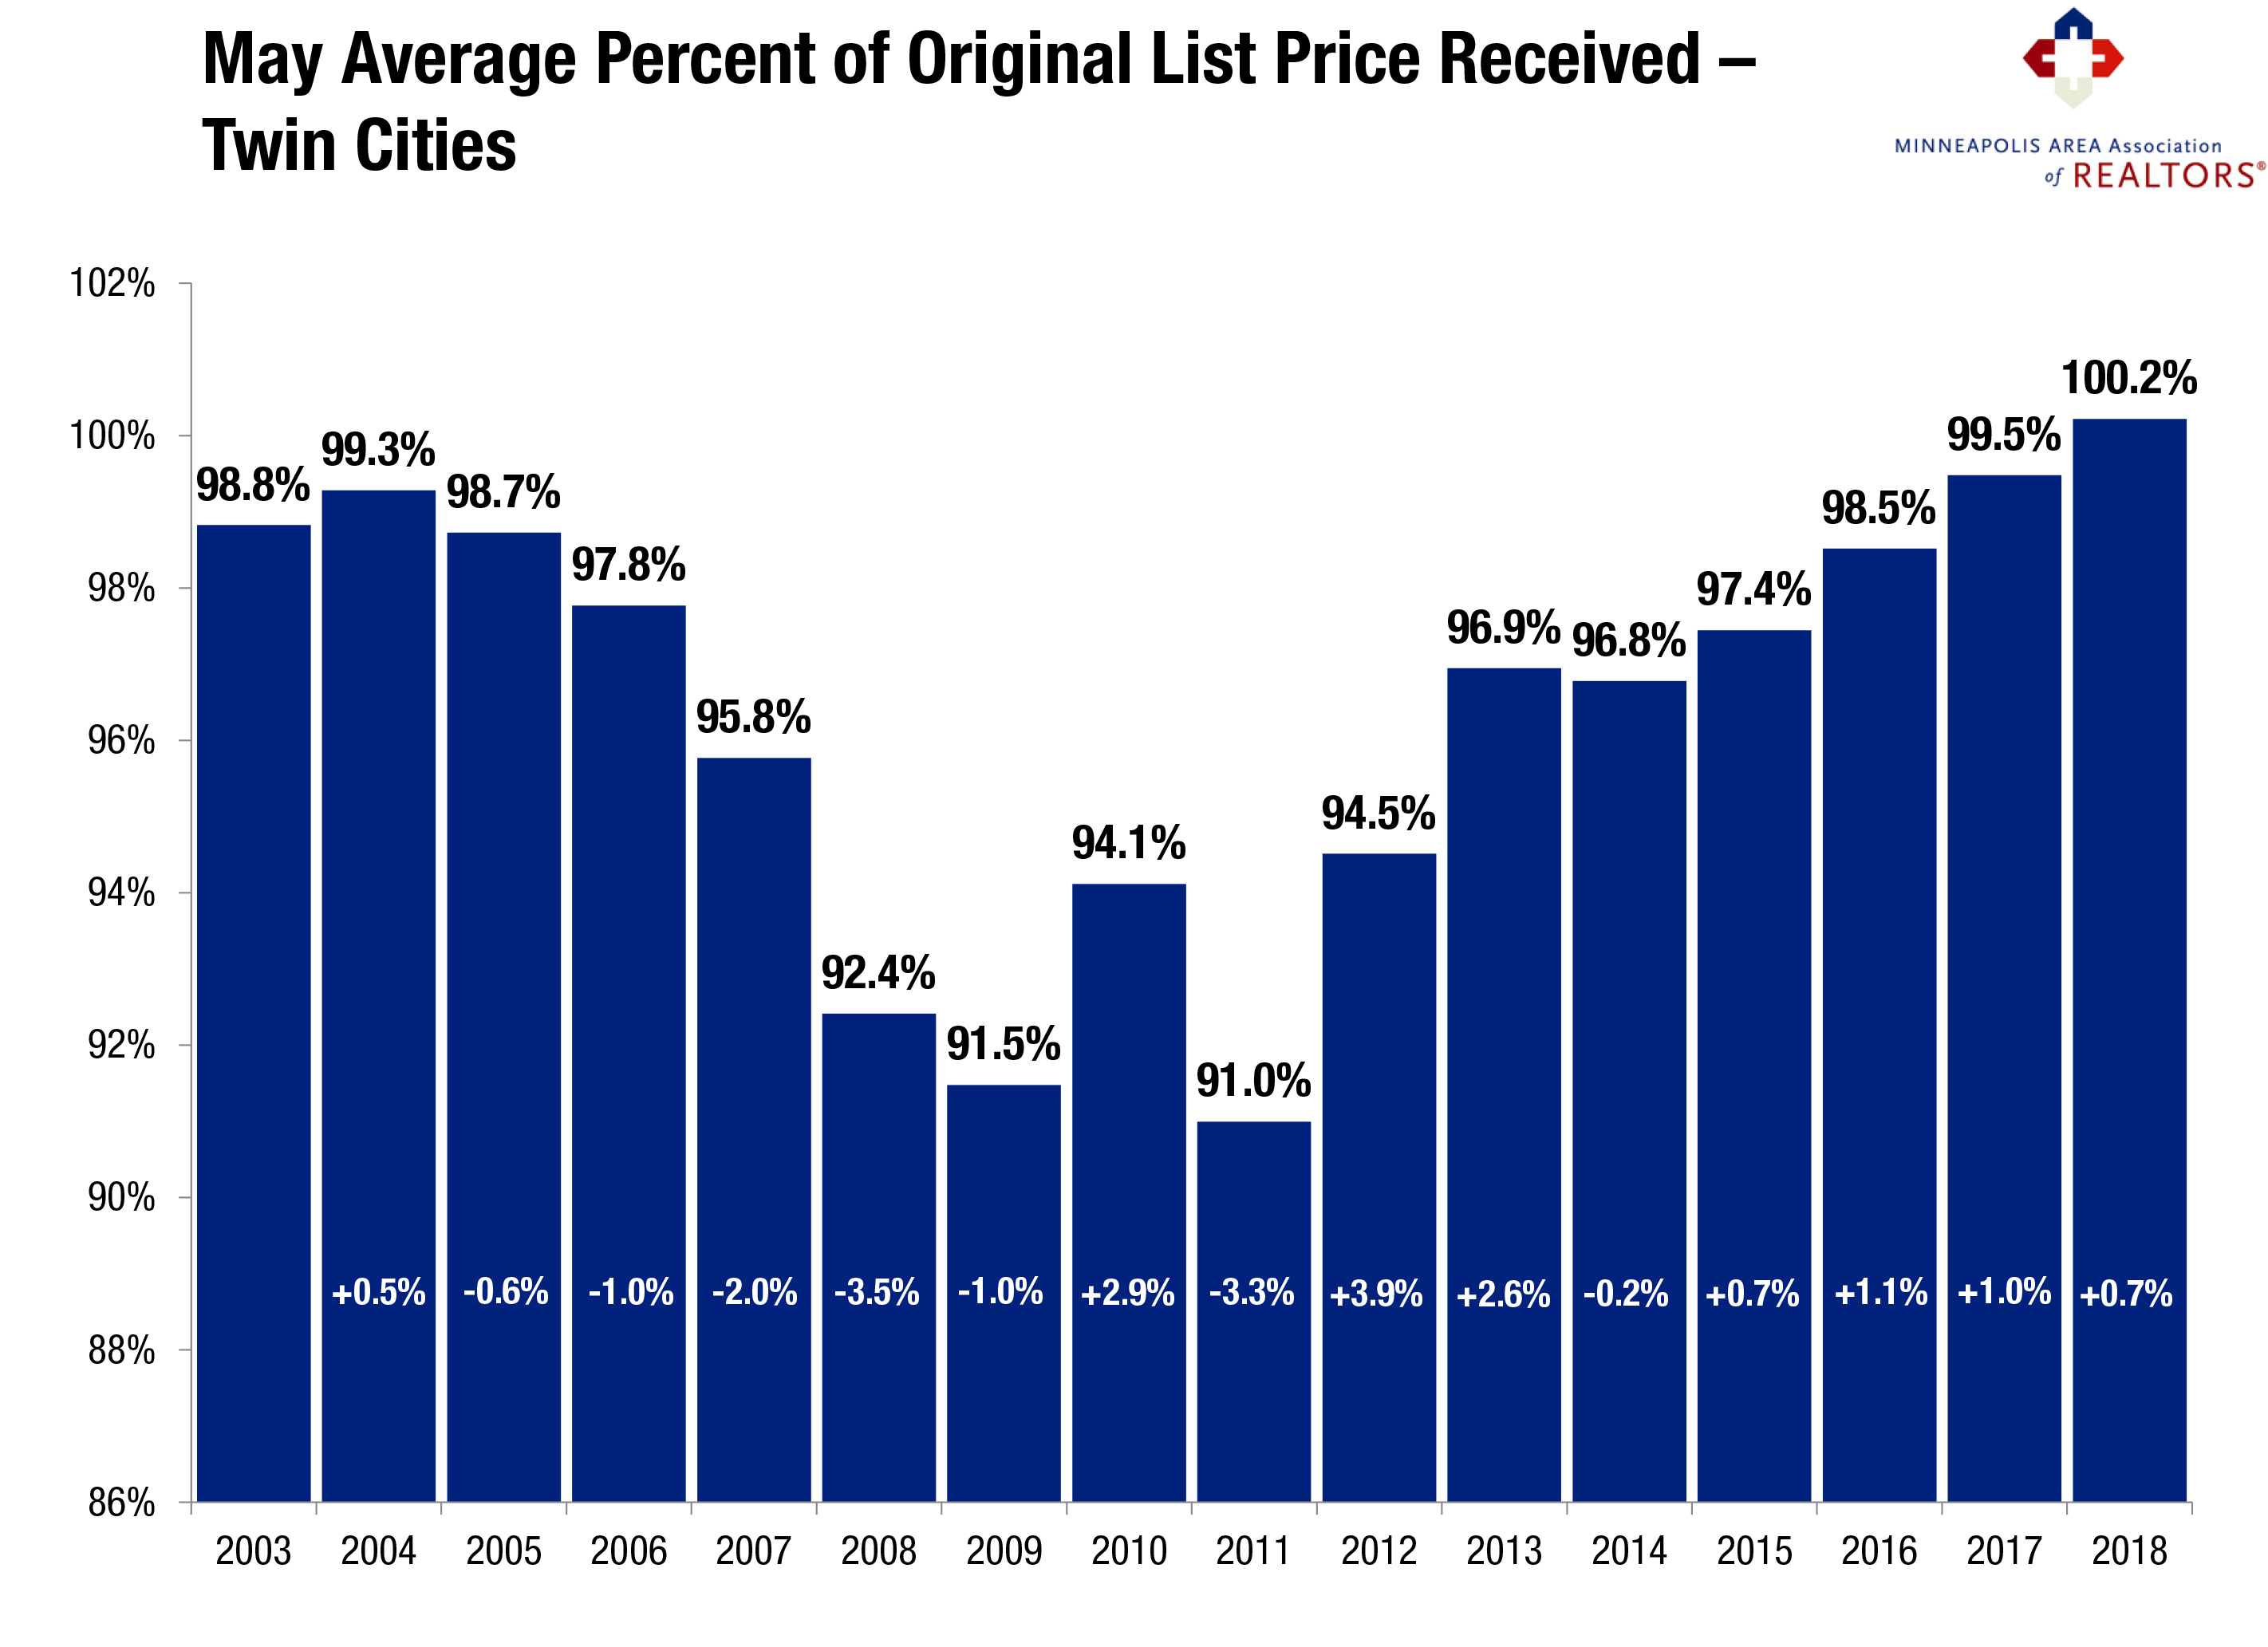
More sellers may finally be jumping into the market at a time when buyers are facing the challenges of low inventory. Since 2013, new listing activity has been subdued relative to buyer activity and hasn’t surpassed 9,000 new listings per month since 2010. Excluding 2010, we haven’t had this many new listings for any month since May 2008. Increasing seller activity and tapering demand are consistent with a marketplace that’s starting to loosen up just a bit. That said, buyers shopping this spring and summer will still face stiff competition. Being successful in this market takes commitment, decisiveness and persistence—traits not necessarily typical of every buyer. In fact, May marked the sixth consecutive month of year-over-year declines in closed sales, likely reflecting the lack of homes for sale and not weakness in the economy. Strong demand combined with low supply means sellers yielded an average of 100.2 percent of their list price in May, a record high for any month and the first time this indicator has exceeded 100.0 percent. The shortage is especially noticeable at the entry-level prices, where multiple offers and homes selling for over list price have become increasingly common. Homes continue to sell quickly and for close to or above list price in this tight market, but nearly 12,000 buyers and sellers managed to transact real property last month.
May 2018 by the Numbers (compared to a year ago)
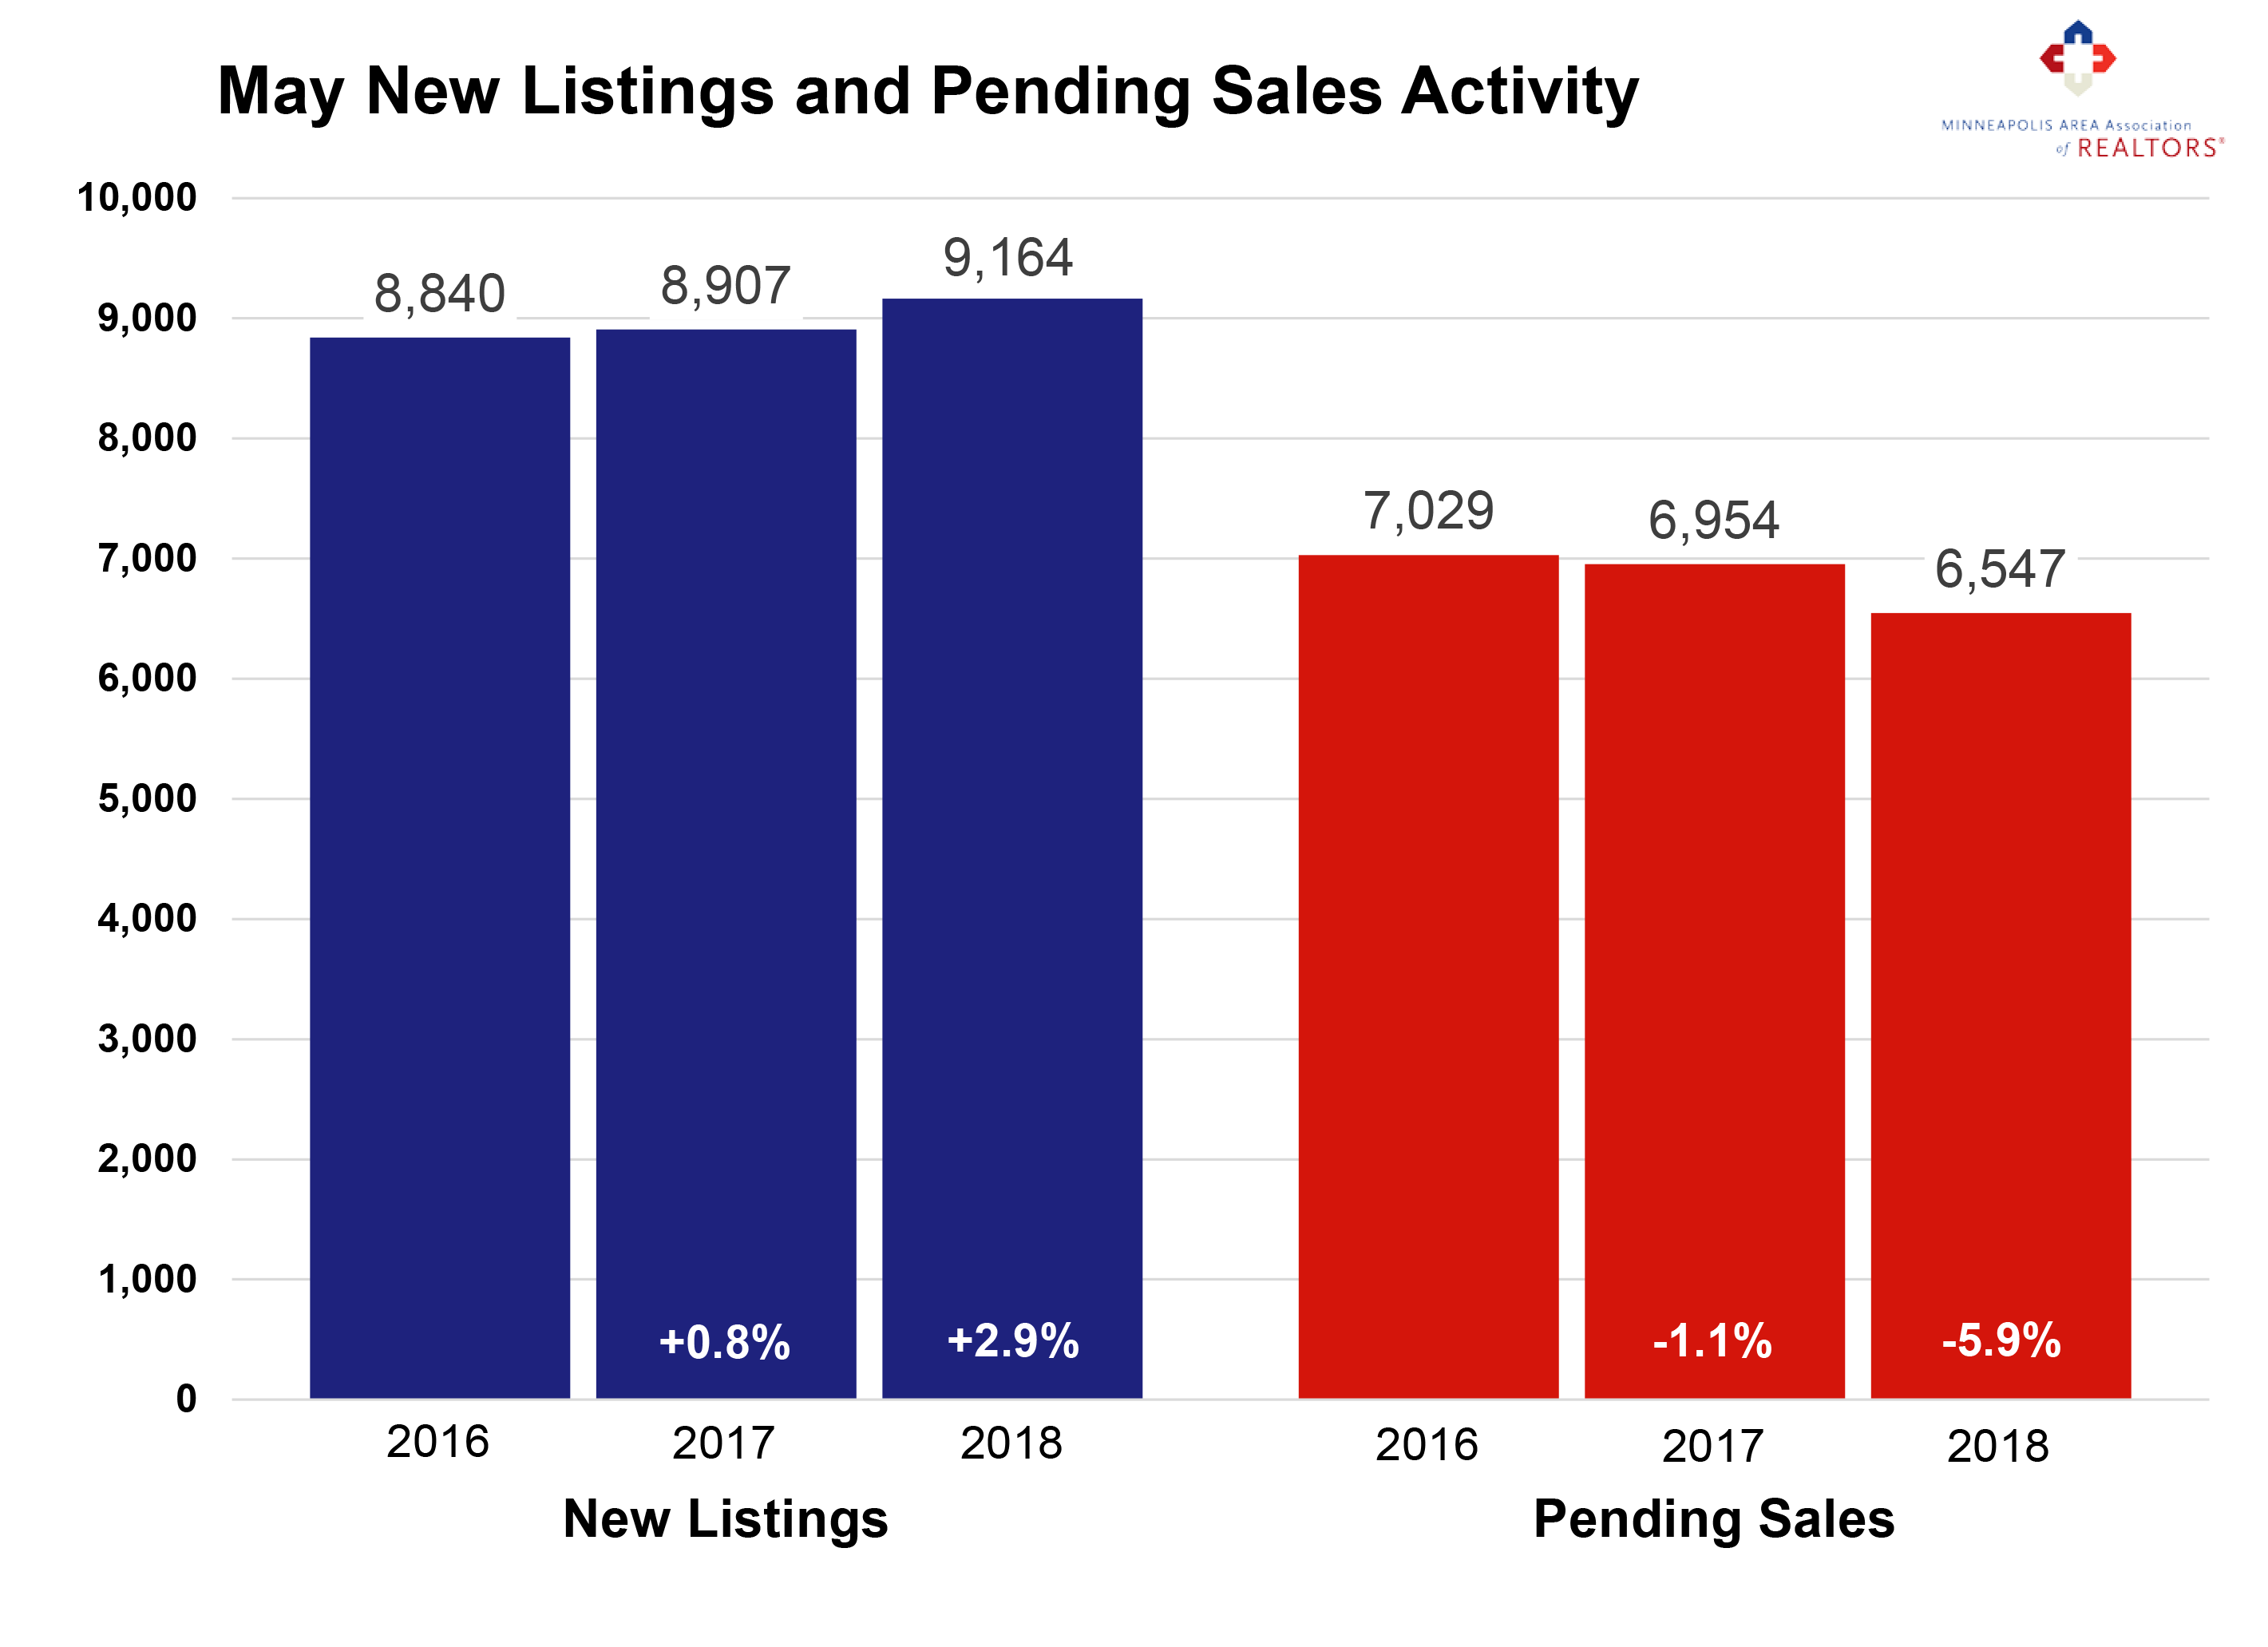
Sellers listed 9,164 properties on the market, a 2.9 percent increase
Buyers closed on 5,739 homes, a 11.3 percent decrease
Inventory levels for May fell 17.8 percent compared to 2017 to 10,403 units
Months Supply of Inventory was down 16.0 percent to 2.1 months
The Median Sales Price rose 8.4 percent to $271,000, a record high
Cumulative Days on Market declined 9.6 percent to 47 days, on average (median of 17)
Changes in Sales activity varied by market segment
Single family sales sank 12.3 percent; condo sales fell 3.5 percent; townhome sales declined 7.5 percent
Traditional sales fell 9.7 percent; foreclosure sales sank 38.1 percent; short sales plummeted 59.7 percent
Previously-owned sales fell 12.4 percent; new construction sales rose 11.1 percent
From The Skinny Blog.